Processing individual modalities and multimodal integration of 3k brain cells
Contents
Processing individual modalities and multimodal integration of 3k brain cells#
This notebooks demonstrates how individual modalities are processed and integrated to prepare the ground for downstream analysis.
[1]:
# Change directory to the root folder of the repository
import os
os.chdir("../../")
Load libraries and data#
Import libraries:
[2]:
import numpy as np
import pandas as pd
import scanpy as sc
import anndata as ad
[3]:
import muon as mu
[4]:
mu.set_options(display_style = "html", display_html_expand = 0b000)
[4]:
<muon._core.config.set_options at 0x1337c7940>
Download the data that we will use for this series of notebooks.
It can be conveniently obtained with the mudatasets library so that multiple files are downloaded and loaded in a MuData object:
[5]:
import mudatasets
mdata = mudatasets.load("brain3k_multiome", full=True)
mdata.var_names_make_unique()
■ File filtered_feature_bc_matrix.h5 from brain3k_multiome has been found at ~/mudatasets/brain3k_multiome/filtered_feature_bc_matrix.h5
■ Checksum is validated (md5) for filtered_feature_bc_matrix.h5
■ File atac_fragments.tsv.gz from brain3k_multiome has been found at ~/mudatasets/brain3k_multiome/atac_fragments.tsv.gz
■ Checksum is validated (md5) for atac_fragments.tsv.gz
■ File atac_fragments.tsv.gz.tbi from brain3k_multiome has been found at ~/mudatasets/brain3k_multiome/atac_fragments.tsv.gz.tbi
■ Checksum is validated (md5) for atac_fragments.tsv.gz.tbi
■ File atac_peaks.bed from brain3k_multiome has been found at ~/mudatasets/brain3k_multiome/atac_peaks.bed
■ Checksum is validated (md5) for atac_peaks.bed
■ File atac_peak_annotation.tsv from brain3k_multiome has been found at ~/mudatasets/brain3k_multiome/atac_peak_annotation.tsv
■ Checksum is validated (md5) for atac_peak_annotation.tsv
■ Loading filtered_feature_bc_matrix.h5...
/usr/local/opt/python@3.8/Frameworks/Python.framework/Versions/3.8/lib/python3.8/site-packages/mudatasets/core.py:203: UserWarning: Dataset is in the 10X .h5 format and can't be loaded as backed.
  warn("Dataset is in the 10X .h5 format and can't be loaded as backed.")
Variable names are not unique. To make them unique, call `.var_names_make_unique`.
Added `interval` annotation for features from ~/mudatasets/brain3k_multiome/filtered_feature_bc_matrix.h5
Variable names are not unique. To make them unique, call `.var_names_make_unique`.
/usr/local/opt/python@3.8/Frameworks/Python.framework/Versions/3.8/lib/python3.8/site-packages/mudata/_core/mudata.py:396: UserWarning: var_names are not unique. To make them unique, call `.var_names_make_unique`.
  warnings.warn(
Added peak annotation from ~/mudatasets/brain3k_multiome/atac_peak_annotation.tsv to .uns['atac']['peak_annotation']
Added gene names to peak annotation in .uns['atac']['peak_annotation']
Located fragments file: ~/mudatasets/brain3k_multiome/atac_fragments.tsv.gz
More details about using
mudatasetsand available datasets can be found in its repository.
For the record, the original data is available here, and we will use the following files:
Filtered feature barcode matrix (HDF5)
ATAC peak annotations based on proximal genes (TSV)
ATAC Per fragment information file (TSV.GZ)
ATAC Per fragment information index (TSV.GZ index)
[6]:
mdata
[6]:
Metadata.obs0 elements
No metadataEmbeddings & mappings.obsm2 elements
| rna | bool | numpy.ndarray | |
| atac | bool | numpy.ndarray |
Distances.obsp0 elements
No distancesrna3233 × 36601
AnnData object 3233 obs × 36601 varLayers.layers0 elements
No layersMetadata.obs0 elements
No metadataEmbeddings.obsm0 elements
No embeddingsDistances.obsp0 elements
No distancesMiscellaneous.uns0 elements
No miscellaneousatac3233 × 134030
AnnData object 3233 obs × 134030 varLayers.layers0 elements
No layersMetadata.obs0 elements
No metadataEmbeddings.obsm0 elements
No embeddingsDistances.obsp0 elements
No distancesMiscellaneous.uns2 elements
| atac | collections.OrderedDict | 1 element | peak_annotation: DataFrame (175595 x 3) |
| files | collections.OrderedDict | 1 element | fragments: ~/mudatasets/brain3k_multiome/atac_fragments.tsv.gz |
Processing RNA#
Here, we’ll perform some QC and processing steps including normalisation.
[7]:
# `rna` will point to `mdata['rna']`
# unless we copy it
rna = mdata['rna']
QC#
[8]:
rna.var['mt'] = rna.var_names.str.startswith('MT-')  # annotate the group of mitochondrial genes as 'mt'
sc.pp.calculate_qc_metrics(rna, qc_vars=['mt'], percent_top=None, log1p=False, inplace=True)
[9]:
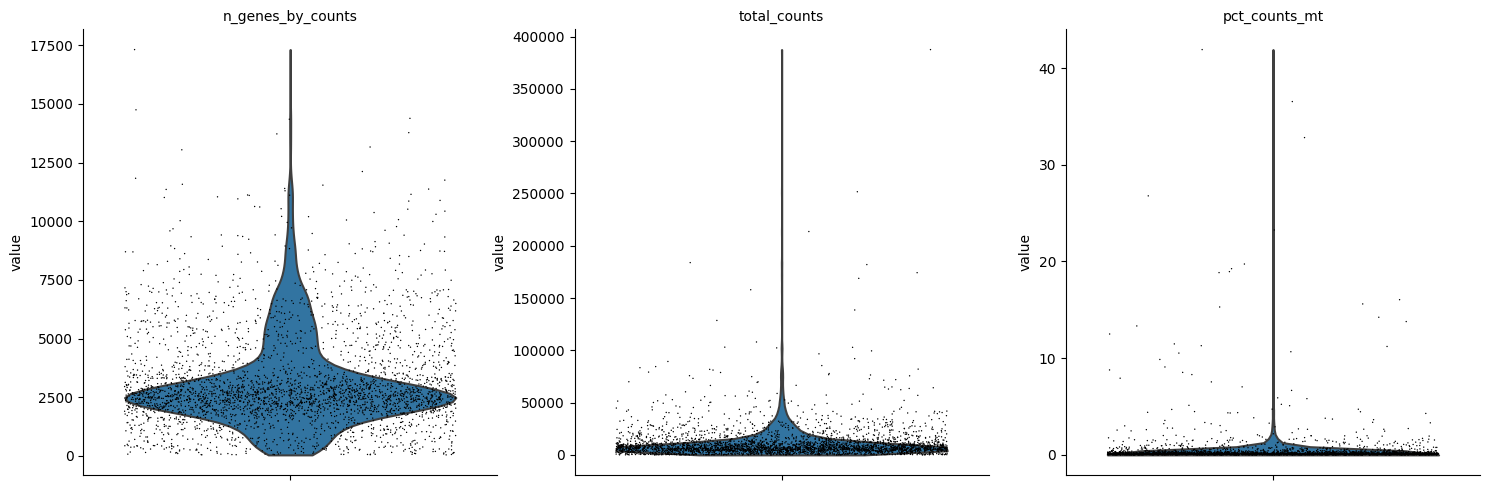
sc.pl.violin(rna, ['n_genes_by_counts', 'total_counts', 'pct_counts_mt'],
             jitter=0.4, multi_panel=True)
/usr/local/opt/python@3.8/Frameworks/Python.framework/Versions/3.8/lib/python3.8/site-packages/anndata/_core/anndata.py:1228: FutureWarning: The `inplace` parameter in pandas.Categorical.reorder_categories is deprecated and will be removed in a future version. Reordering categories will always return a new Categorical object.
  c.reorder_categories(natsorted(c.categories), inplace=True)
... storing 'feature_types' as categorical
/usr/local/opt/python@3.8/Frameworks/Python.framework/Versions/3.8/lib/python3.8/site-packages/anndata/_core/anndata.py:1228: FutureWarning: The `inplace` parameter in pandas.Categorical.reorder_categories is deprecated and will be removed in a future version. Reordering categories will always return a new Categorical object.
  c.reorder_categories(natsorted(c.categories), inplace=True)
... storing 'genome' as categorical
/usr/local/opt/python@3.8/Frameworks/Python.framework/Versions/3.8/lib/python3.8/site-packages/anndata/_core/anndata.py:1228: FutureWarning: The `inplace` parameter in pandas.Categorical.reorder_categories is deprecated and will be removed in a future version. Reordering categories will always return a new Categorical object.
  c.reorder_categories(natsorted(c.categories), inplace=True)
... storing 'interval' as categorical
[10]:
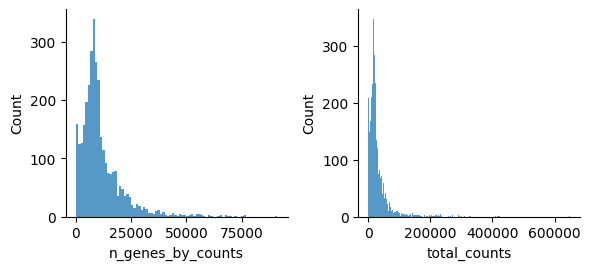
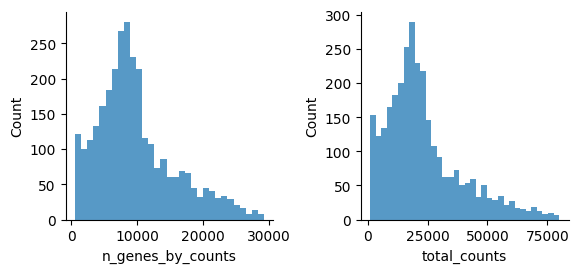
print(f"Before: {rna.n_obs} cells")
mu.pp.filter_obs(rna, 'n_genes_by_counts', lambda x: (x >= 200) & (x < 8000))
print(f"(After n_genes: {rna.n_obs} cells)")
mu.pp.filter_obs(rna, 'total_counts', lambda x: x < 40000)
print(f"(After total_counts: {rna.n_obs} cells)")
mu.pp.filter_obs(rna, 'pct_counts_mt', lambda x: x < 2)
print(f"After: {rna.n_obs} cells")
Before: 3233 cells
(After n_genes: 3084 cells)
(After total_counts: 3065 cells)
After: 3020 cells
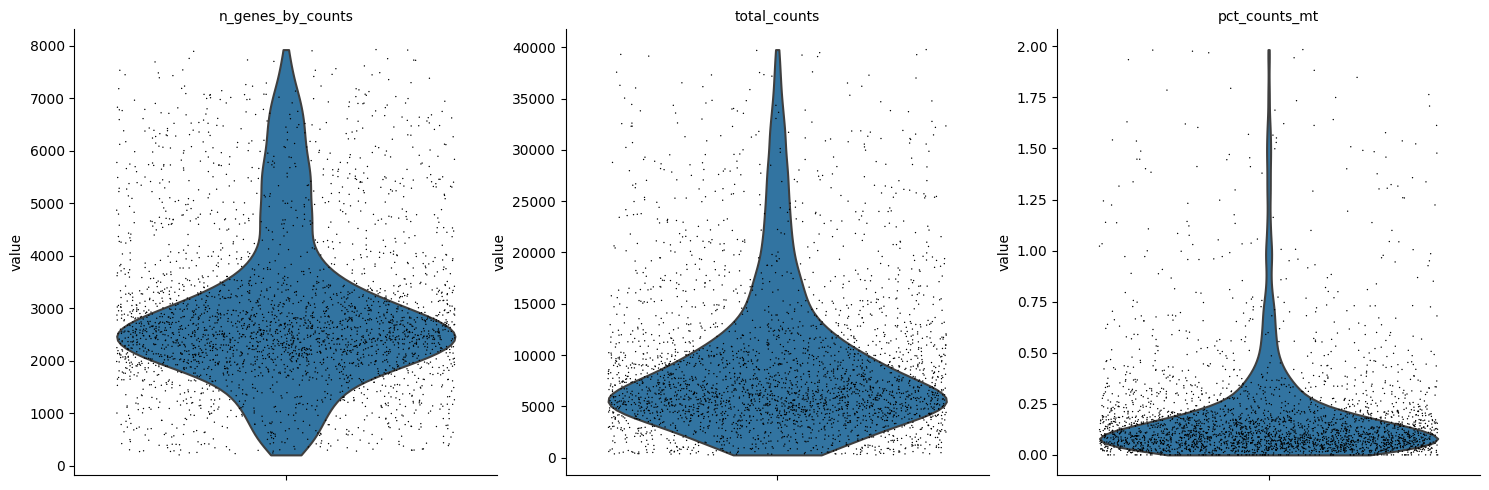
Let’s see how the data looks after filtering:
[11]:
sc.pl.violin(rna, ['n_genes_by_counts', 'total_counts', 'pct_counts_mt'],
             jitter=0.4, multi_panel=True)
Normalisation#
[12]:
rna.layers["counts"] = rna.X.copy()
sc.pp.normalize_total(rna, target_sum=1e4)
sc.pp.log1p(rna)
# rna.raw = rna
rna.layers["lognorm"] = rna.X.copy()
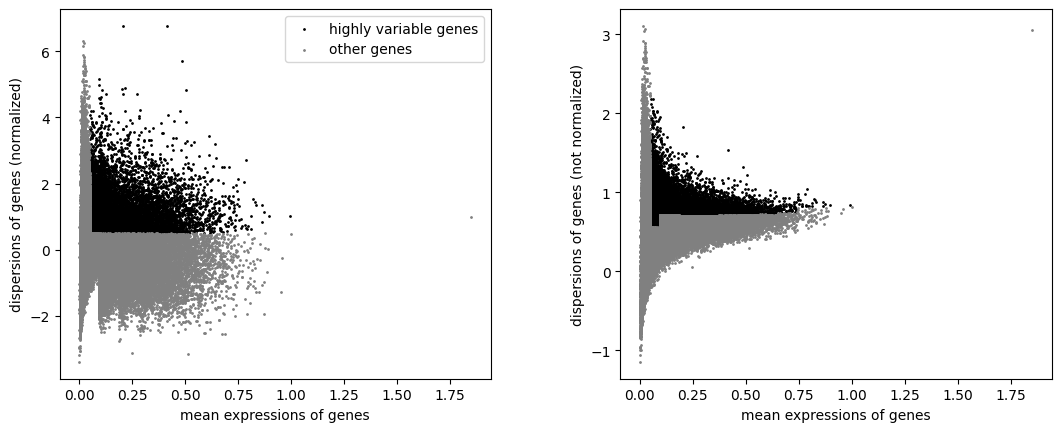
Define informative features#
[13]:
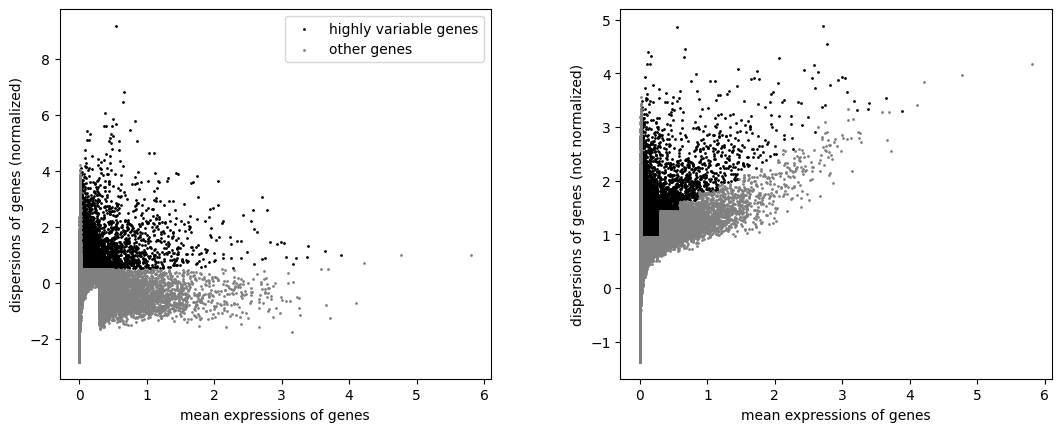
sc.pp.highly_variable_genes(rna, min_mean=0.02, max_mean=4, min_disp=0.5)
[14]:
sc.pl.highly_variable_genes(rna)
[15]:
np.sum(rna.var.highly_variable)
[15]:
5924
Scaling and PCA#
[16]:
sc.pp.scale(rna, max_value=10)
[17]:
sc.tl.pca(rna, svd_solver='arpack')
[18]:
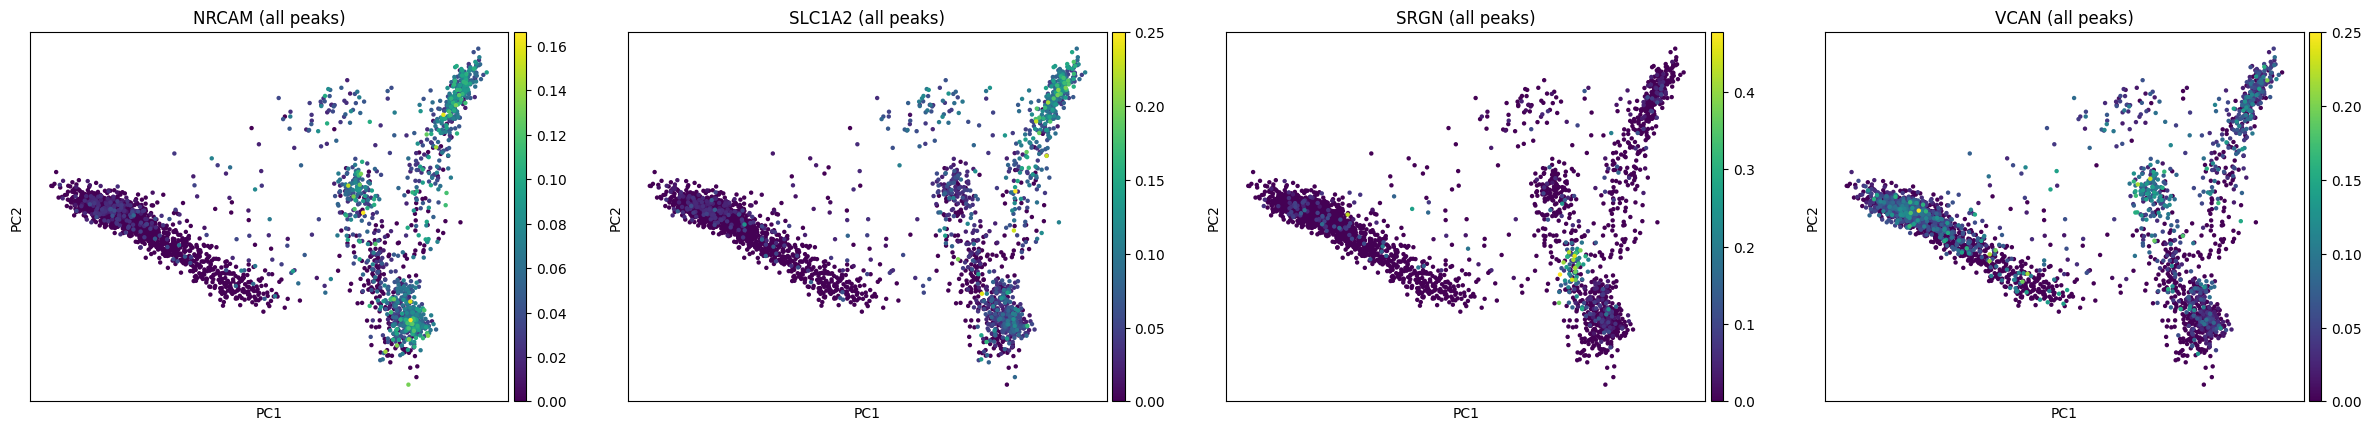
sc.pl.pca(rna, color=['NRCAM', 'SLC1A2', 'SRGN', 'VCAN'])
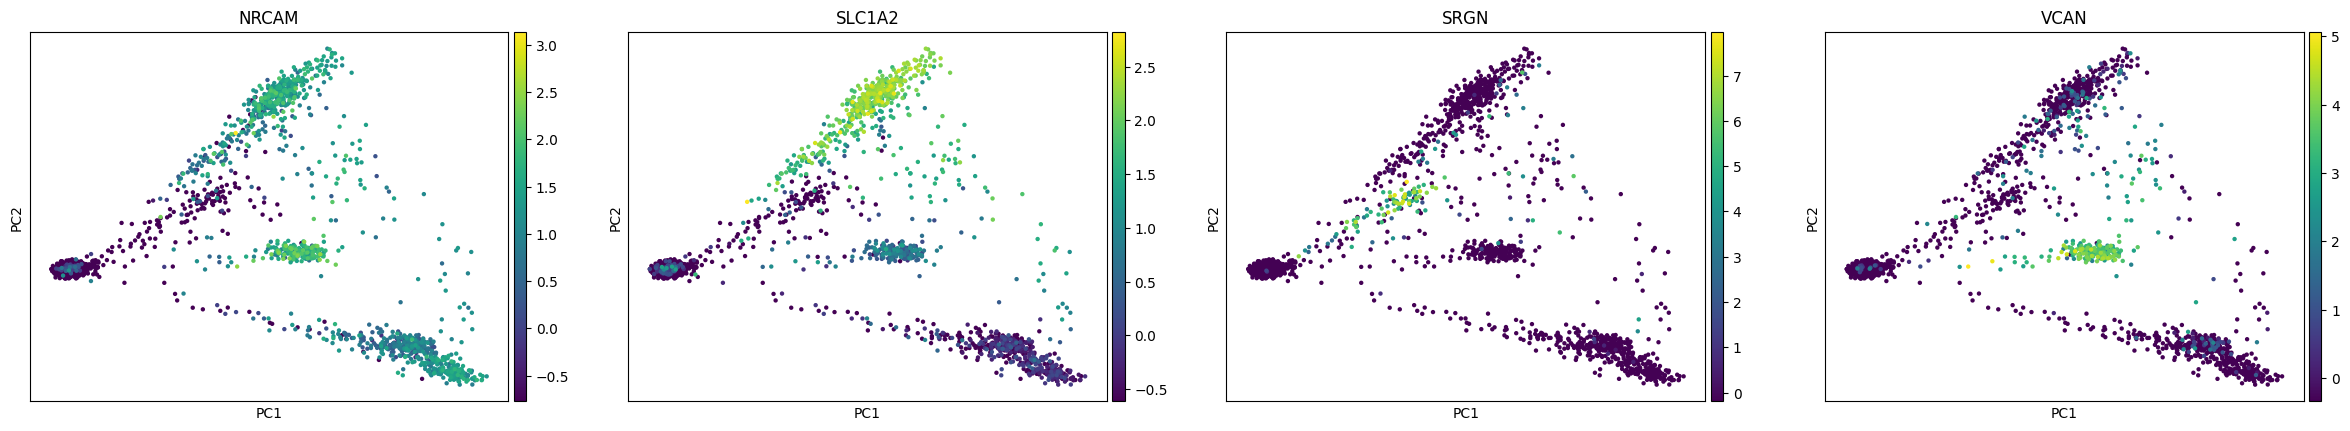
You can see expression of some of these genes and their type and region specificity in the Protein Atlas, e.g. SLC1A2 in astrocytes, SRGN in microglia and VCAN in oligodendrocyte precursor cells.
[19]:
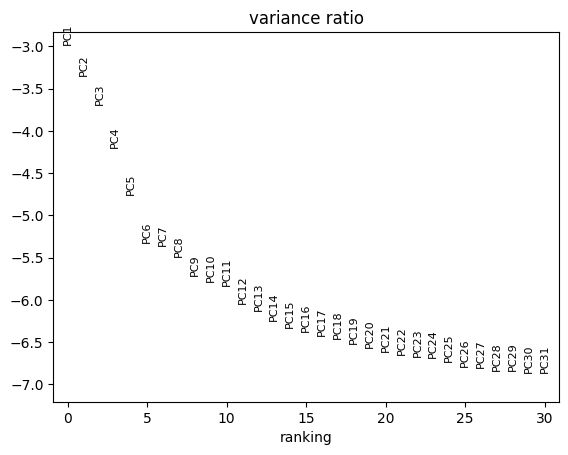
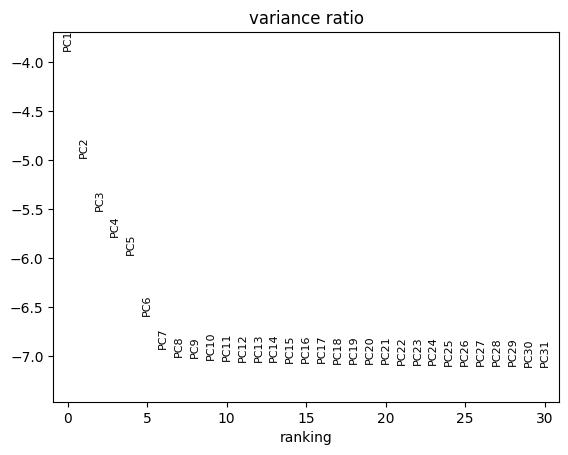
sc.pl.pca_variance_ratio(rna, log=True)
Finding cell neighbours and clustering cells#
[20]:
sc.pp.neighbors(rna, n_neighbors=10, n_pcs=20)
[21]:
sc.tl.leiden(rna, resolution=.5)
Non-linear dimensionality reduction#
[22]:
sc.tl.umap(rna, spread=1., min_dist=.5, random_state=11)
[23]:
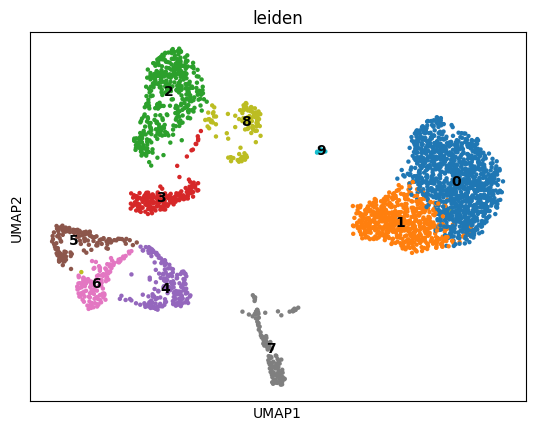
sc.pl.umap(rna, color="leiden", legend_loc="on data")

Marker genes and celltypes#
[24]:
sc.tl.rank_genes_groups(rna, 'leiden', method='t-test')
/usr/local/opt/python@3.8/Frameworks/Python.framework/Versions/3.8/lib/python3.8/site-packages/scanpy/tools/_rank_genes_groups.py:420: RuntimeWarning: invalid value encountered in log2
  self.stats[group_name, 'logfoldchanges'] = np.log2(
/usr/local/opt/python@3.8/Frameworks/Python.framework/Versions/3.8/lib/python3.8/site-packages/scanpy/tools/_rank_genes_groups.py:420: RuntimeWarning: invalid value encountered in log2
  self.stats[group_name, 'logfoldchanges'] = np.log2(
/usr/local/opt/python@3.8/Frameworks/Python.framework/Versions/3.8/lib/python3.8/site-packages/scanpy/tools/_rank_genes_groups.py:420: RuntimeWarning: invalid value encountered in log2
  self.stats[group_name, 'logfoldchanges'] = np.log2(
/usr/local/opt/python@3.8/Frameworks/Python.framework/Versions/3.8/lib/python3.8/site-packages/scanpy/tools/_rank_genes_groups.py:420: RuntimeWarning: invalid value encountered in log2
  self.stats[group_name, 'logfoldchanges'] = np.log2(
/usr/local/opt/python@3.8/Frameworks/Python.framework/Versions/3.8/lib/python3.8/site-packages/scanpy/tools/_rank_genes_groups.py:420: RuntimeWarning: invalid value encountered in log2
  self.stats[group_name, 'logfoldchanges'] = np.log2(
/usr/local/opt/python@3.8/Frameworks/Python.framework/Versions/3.8/lib/python3.8/site-packages/scanpy/tools/_rank_genes_groups.py:420: RuntimeWarning: invalid value encountered in log2
  self.stats[group_name, 'logfoldchanges'] = np.log2(
/usr/local/opt/python@3.8/Frameworks/Python.framework/Versions/3.8/lib/python3.8/site-packages/scanpy/tools/_rank_genes_groups.py:420: RuntimeWarning: invalid value encountered in log2
  self.stats[group_name, 'logfoldchanges'] = np.log2(
/usr/local/opt/python@3.8/Frameworks/Python.framework/Versions/3.8/lib/python3.8/site-packages/scanpy/tools/_rank_genes_groups.py:420: RuntimeWarning: invalid value encountered in log2
  self.stats[group_name, 'logfoldchanges'] = np.log2(
/usr/local/opt/python@3.8/Frameworks/Python.framework/Versions/3.8/lib/python3.8/site-packages/scanpy/tools/_rank_genes_groups.py:420: RuntimeWarning: invalid value encountered in log2
  self.stats[group_name, 'logfoldchanges'] = np.log2(
/usr/local/opt/python@3.8/Frameworks/Python.framework/Versions/3.8/lib/python3.8/site-packages/scanpy/tools/_rank_genes_groups.py:420: RuntimeWarning: invalid value encountered in log2
  self.stats[group_name, 'logfoldchanges'] = np.log2(
/usr/local/opt/python@3.8/Frameworks/Python.framework/Versions/3.8/lib/python3.8/site-packages/scanpy/tools/_rank_genes_groups.py:420: RuntimeWarning: invalid value encountered in log2
  self.stats[group_name, 'logfoldchanges'] = np.log2(
/usr/local/opt/python@3.8/Frameworks/Python.framework/Versions/3.8/lib/python3.8/site-packages/scanpy/tools/_rank_genes_groups.py:420: RuntimeWarning: invalid value encountered in log2
  self.stats[group_name, 'logfoldchanges'] = np.log2(
/usr/local/opt/python@3.8/Frameworks/Python.framework/Versions/3.8/lib/python3.8/site-packages/scanpy/tools/_rank_genes_groups.py:420: RuntimeWarning: invalid value encountered in log2
  self.stats[group_name, 'logfoldchanges'] = np.log2(
/usr/local/opt/python@3.8/Frameworks/Python.framework/Versions/3.8/lib/python3.8/site-packages/scanpy/tools/_rank_genes_groups.py:420: RuntimeWarning: invalid value encountered in log2
  self.stats[group_name, 'logfoldchanges'] = np.log2(
/usr/local/opt/python@3.8/Frameworks/Python.framework/Versions/3.8/lib/python3.8/site-packages/scanpy/tools/_rank_genes_groups.py:420: RuntimeWarning: invalid value encountered in log2
  self.stats[group_name, 'logfoldchanges'] = np.log2(
/usr/local/opt/python@3.8/Frameworks/Python.framework/Versions/3.8/lib/python3.8/site-packages/scanpy/tools/_rank_genes_groups.py:420: RuntimeWarning: invalid value encountered in log2
  self.stats[group_name, 'logfoldchanges'] = np.log2(
[25]:
result = rna.uns['rank_genes_groups']
groups = result['names'].dtype.names
pd.set_option('display.max_columns', 50)
pd.DataFrame(
    {group + '_' + key[:1]: result[key][group]
    for group in groups for key in ['names', 'pvals']}).head(10)
[25]:
| 0_n | 0_p | 1_n | 1_p | 2_n | 2_p | 3_n | 3_p | 4_n | 4_p | 5_n | 5_p | 6_n | 6_p | 7_n | 7_p | 8_n | 8_p | 9_n | 9_p | 10_n | 10_p | 11_n | 11_p | 12_n | 12_p | 13_n | 13_p | 14_n | 14_p | 15_n | 15_p | |
|---|---|---|---|---|---|---|---|---|---|---|---|---|---|---|---|---|---|---|---|---|---|---|---|---|---|---|---|---|---|---|---|---|
| 0 | PLP1 | 0.000000e+00 | CTNNA3 | 0.000000e+00 | SLC1A2 | 0.000000e+00 | CTNNA3 | 0.000000e+00 | PCDH15 | 2.652644e-260 | MALAT1 | 7.906135e-50 | KCNIP4 | 0.000000e+00 | DLGAP1 | 8.963566e-194 | LRMDA | 6.608572e-69 | SNHG14 | 1.318458e-152 | GPC5 | 4.747626e-143 | PITPNC1 | 9.111519e-22 | GPC5 | 7.653579e-83 | SYT1 | 2.014135e-63 | PLP1 | 1.274503e-33 | GRIP1 | 3.853040e-36 |
| 1 | CNP | 0.000000e+00 | ST18 | 1.992302e-290 | GPC5 | 0.000000e+00 | ST18 | 6.978186e-266 | DSCAM | 2.336696e-305 | CTNNA3 | 1.591178e-39 | RBFOX1 | 0.000000e+00 | RBFOX1 | 2.306675e-165 | CD83 | 4.238996e-53 | MYT1L | 4.228744e-112 | GPM6A | 6.184337e-127 | SORBS1 | 2.769325e-21 | ADGRV1 | 1.086910e-69 | RIMS2 | 1.193609e-67 | ST18 | 2.647254e-33 | KAZN | 1.975049e-45 |
| 2 | CRYAB | 0.000000e+00 | PIP4K2A | 1.775347e-282 | ADGRV1 | 0.000000e+00 | DPYD | 7.124458e-183 | OPCML | 0.000000e+00 | HSP90AA1 | 4.793518e-36 | HS6ST3 | 1.256068e-204 | SNHG14 | 1.267656e-150 | ST6GAL1 | 6.552671e-52 | ADARB2 | 2.600669e-107 | SLC1A2 | 4.501662e-99 | ATP1B3 | 1.189084e-20 | CTNNA2 | 6.599894e-87 | RALYL | 5.803705e-50 | DPYD | 1.470305e-28 | CCSER1 | 5.615775e-40 |
| 3 | DBNDD2 | 1.140926e-286 | SLC44A1 | 2.344859e-284 | GPM6A | 0.000000e+00 | RNF220 | 1.548406e-180 | PTPRZ1 | 2.238103e-246 | DST | 6.047507e-33 | CSMD1 | 0.000000e+00 | SYT1 | 8.597039e-104 | SRGAP2 | 8.299153e-52 | KAZN | 1.972062e-117 | CTNNA2 | 1.565429e-127 | MSI2 | 2.379704e-20 | SLC1A2 | 2.793749e-65 | CSMD1 | 4.780335e-68 | MBP | 2.456123e-28 | RBFOX1 | 7.619173e-44 |
| 4 | PTGDS | 0.000000e+00 | IL1RAPL1 | 1.201356e-292 | RYR3 | 6.273018e-302 | SLC44A1 | 1.418382e-219 | LHFPL3 | 2.683399e-174 | SLC24A2 | 3.026886e-23 | MEG3 | 4.656631e-203 | PCLO | 7.207201e-97 | SFMBT2 | 4.823747e-52 | CCSER1 | 2.340052e-97 | SOX5 | 5.678717e-104 | MALAT1 | 6.752891e-19 | NRG3 | 3.185427e-82 | KALRN | 3.398583e-57 | CTNNA3 | 3.127268e-29 | RGS7 | 1.476733e-37 |
| 5 | APLP1 | 1.209001e-294 | DOCK10 | 1.944916e-276 | PITPNC1 | 0.000000e+00 | MBP | 5.637242e-199 | TNR | 2.855693e-170 | CCDC88A | 1.073638e-19 | LRRTM4 | 4.263504e-303 | ATRNL1 | 6.402239e-104 | MEF2C | 2.862382e-52 | FGF14 | 5.598255e-104 | ADGRV1 | 8.510522e-89 | ZNF331 | 5.170967e-18 | GPM6A | 3.110578e-63 | FAM155A | 5.268105e-71 | CRYAB | 1.195638e-21 | ATP8A2 | 4.490743e-32 |
| 6 | MBP | 0.000000e+00 | RNF220 | 1.347821e-259 | CTNNA2 | 0.000000e+00 | IL1RAPL1 | 3.051642e-209 | LUZP2 | 1.352114e-163 | RNF220 | 5.682518e-20 | CHRM3 | 9.130756e-163 | NRG3 | 6.918291e-163 | PLXDC2 | 1.746137e-53 | CHRM3 | 2.419674e-85 | DTNA | 6.489832e-107 | NR4A3 | 3.365677e-15 | NRXN1 | 4.834023e-77 | NRG3 | 1.653593e-76 | ENPP2 | 3.207358e-24 | SYT1 | 5.838566e-34 |
| 7 | FTH1 | 2.670045e-306 | SIK3 | 1.819625e-253 | LSAMP | 0.000000e+00 | PIP4K2A | 7.201469e-174 | KCNIP4 | 0.000000e+00 | IL1RAPL1 | 6.968710e-21 | PHACTR1 | 1.999672e-227 | RIMS2 | 1.884141e-98 | CHST11 | 5.488205e-50 | MEG3 | 5.315741e-91 | NKAIN3 | 4.128601e-84 | ESYT2 | 6.388757e-15 | SOX5 | 2.943574e-61 | LDB2 | 9.921844e-48 | NKAIN2 | 1.214277e-23 | FGF13 | 4.472785e-28 |
| 8 | RNASE1 | 4.994825e-237 | ELMO1 | 4.212537e-267 | SOX5 | 0.000000e+00 | TMEM165 | 7.257380e-161 | LRRC4C | 2.475997e-240 | ST18 | 8.850388e-16 | KALRN | 2.925946e-186 | GRIP1 | 2.286657e-86 | ITPR2 | 1.985314e-51 | GALNTL6 | 3.329208e-80 | NRXN1 | 7.657986e-115 | NR4A2 | 1.847265e-14 | NTM | 1.974336e-78 | DLGAP2 | 2.893882e-49 | ATP8A1 | 2.987282e-22 | MTUS2 | 6.490847e-31 |
| 9 | QDPR | 1.806916e-286 | SLC24A2 | 4.128419e-255 | NRXN1 | 0.000000e+00 | DOCK10 | 2.027642e-165 | CSMD1 | 9.004584e-279 | POLR2F | 2.904285e-15 | SYT1 | 4.039716e-199 | KAZN | 8.369727e-100 | FRMD4A | 4.761944e-51 | FRMD4A | 1.877699e-95 | LINC00299 | 2.855548e-75 | TLE1 | 1.991057e-14 | RYR3 | 2.825641e-54 | GABRB2 | 3.786100e-50 | MAN2A1 | 2.470968e-20 | DAB1 | 1.382530e-34 |
[26]:
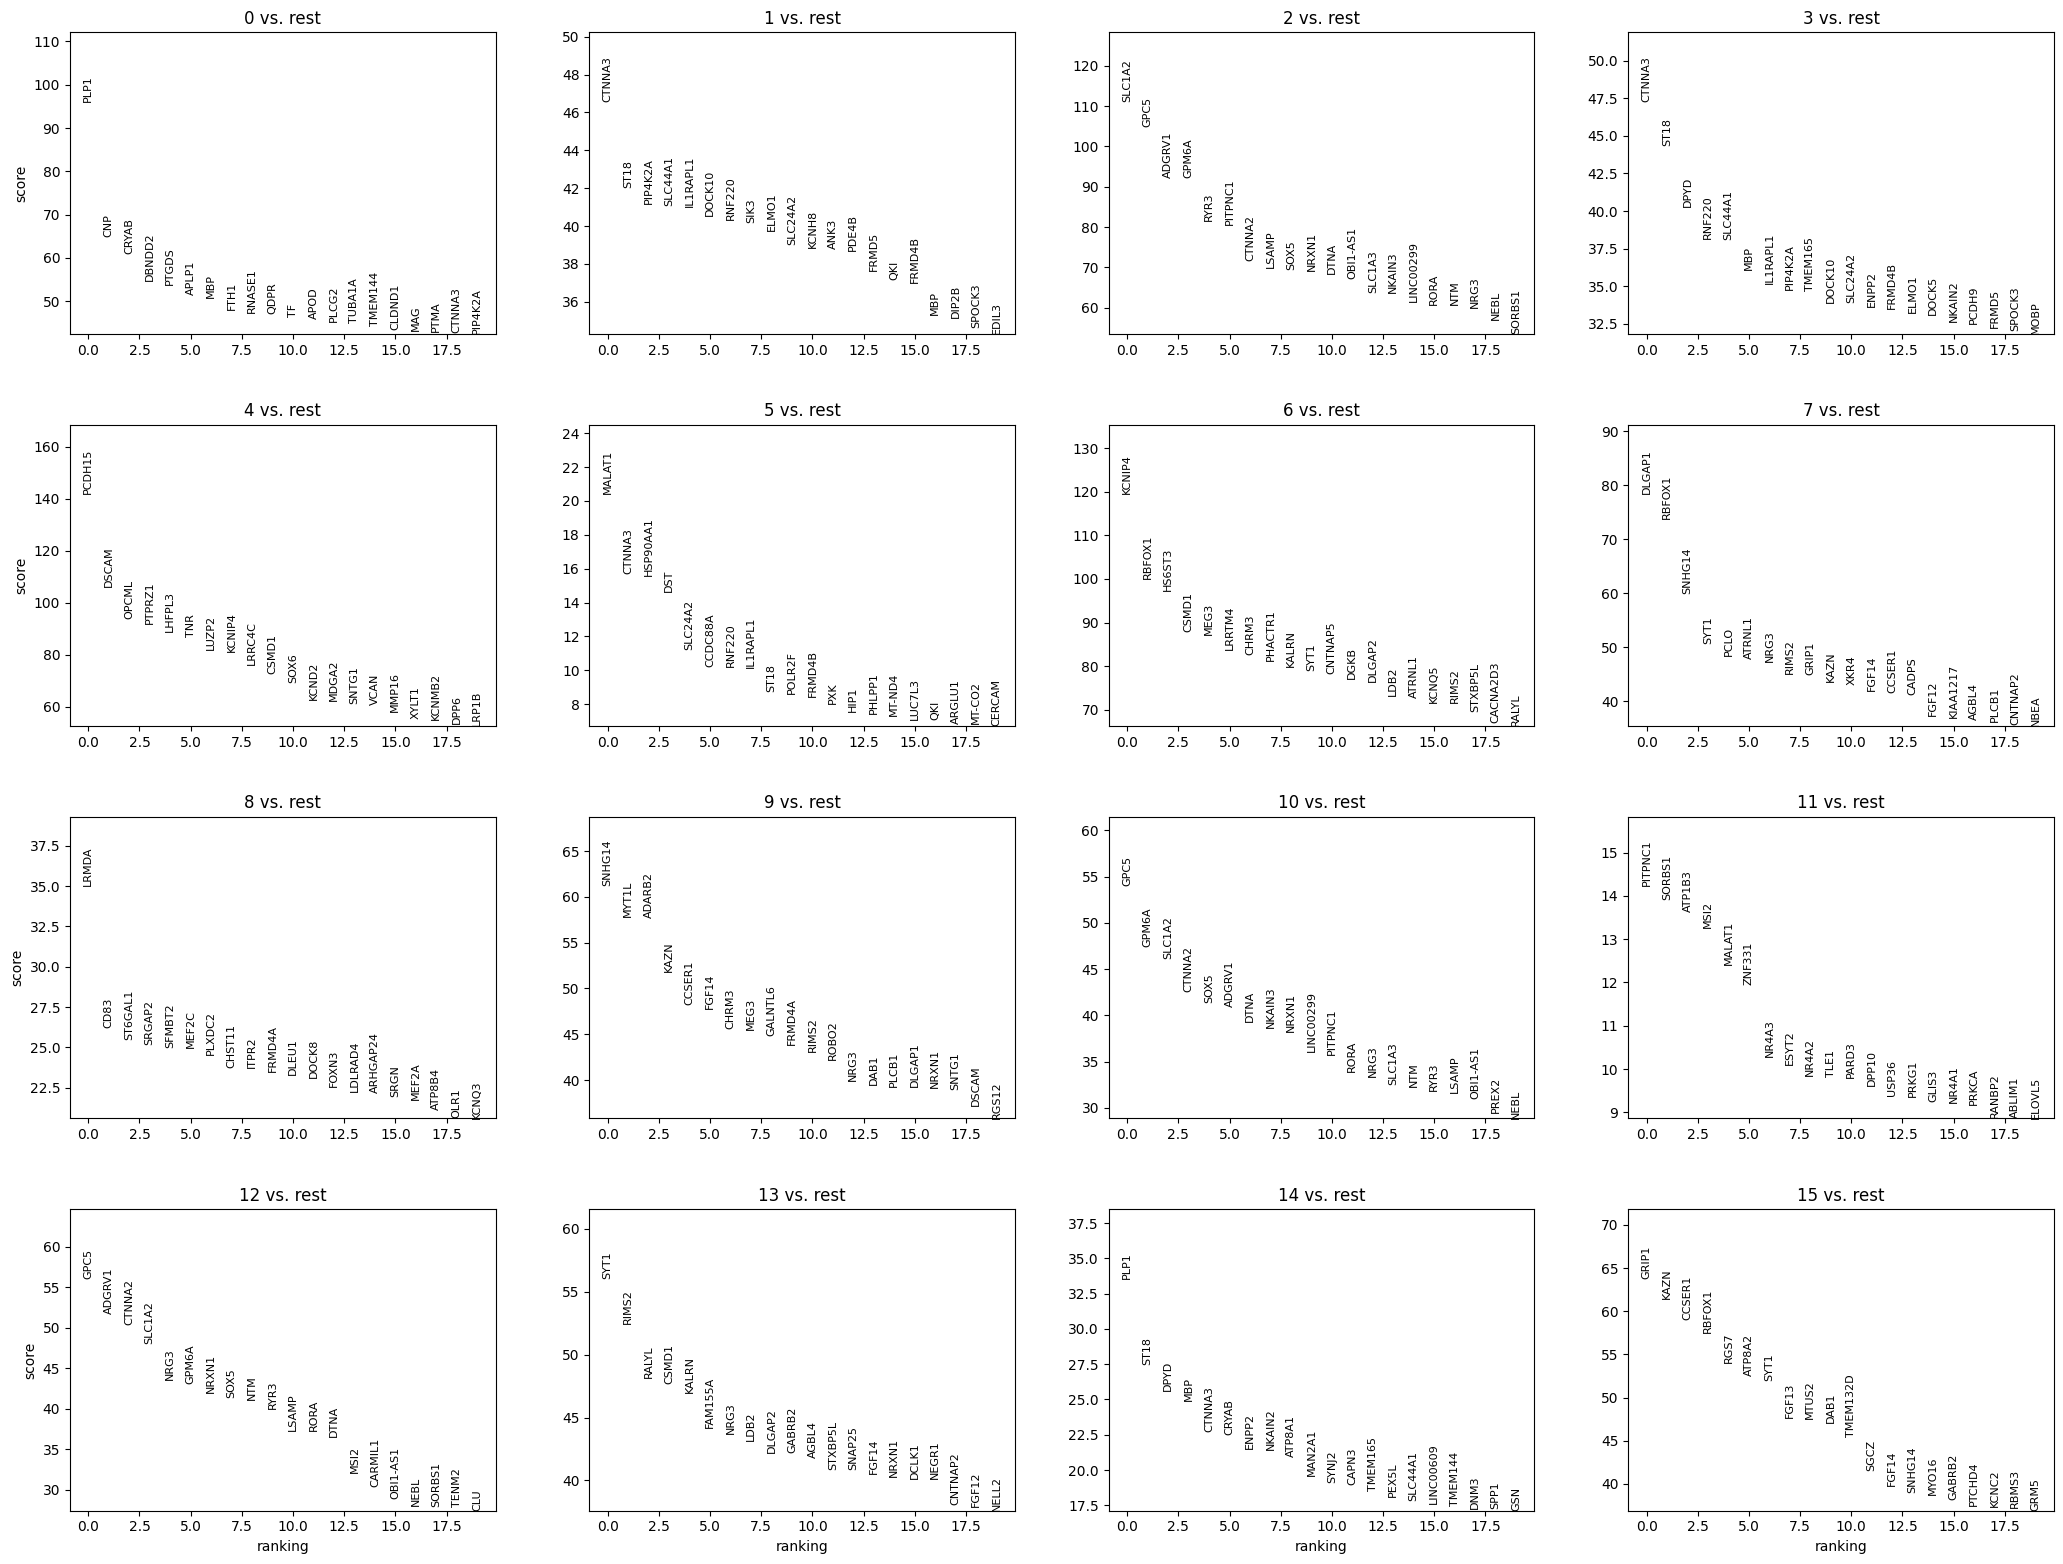
sc.pl.rank_genes_groups(rna, n_genes=20, sharey=False)
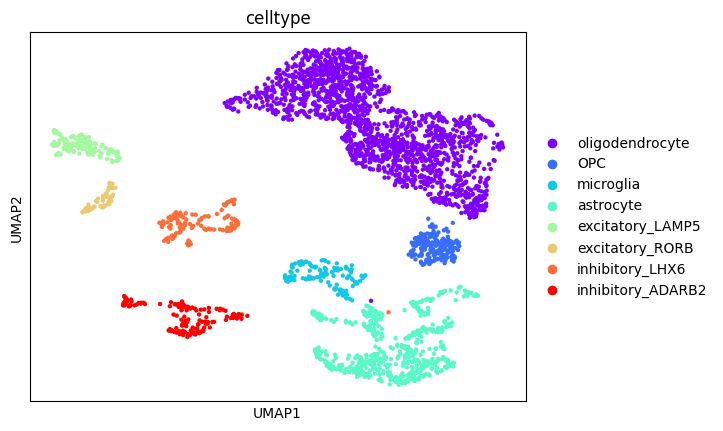
Cell type annotation#
There are multiple complementary approaches to assign biologically meaningful cluster labels.
Marker genes#
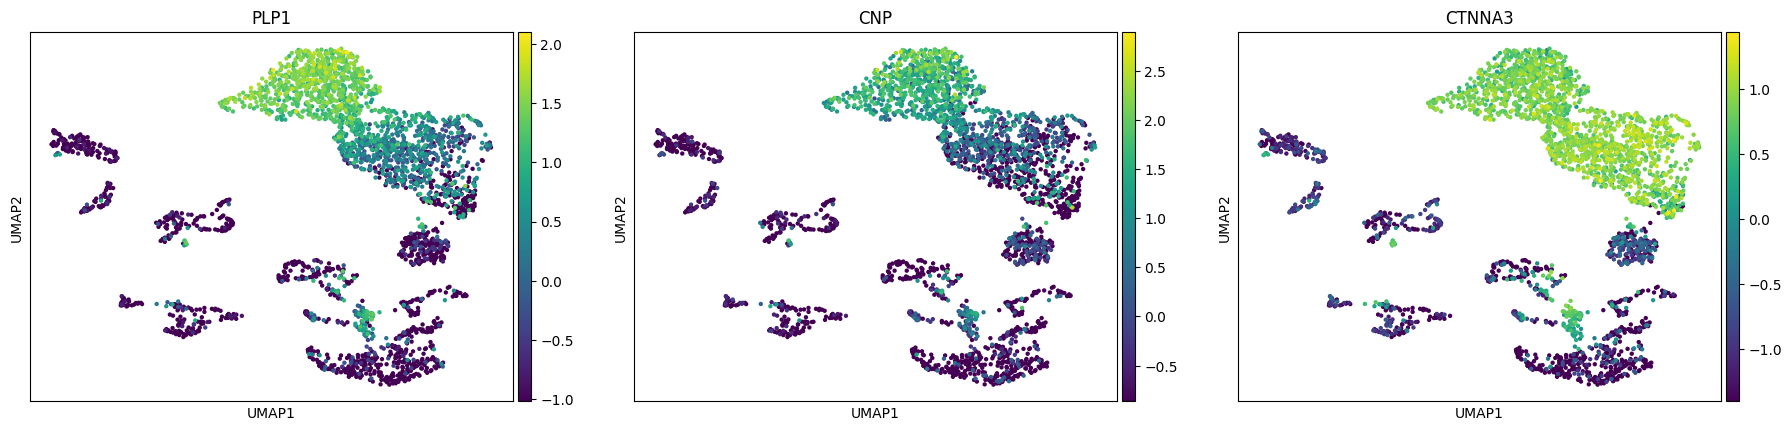
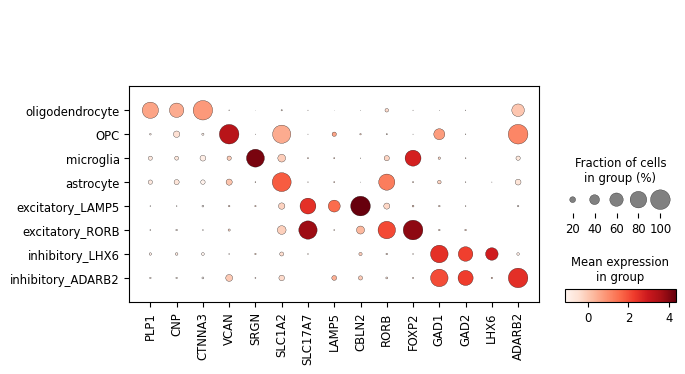
A straightforward approach is to look at each cluster’s marker genes. For instance, Proteolipid protein 1 (PLP1) together with 2′,3′-Cyclic nucleotide phosphodiesterase (CNP) indicate that the cluster 0 is likely to consist of oligodendrocytes. With CTNNA3, which is characeristic for oligodendrocytes, we can assign this label to other clusters as well (1, 3, 5, 14).
[27]:
sc.pl.umap(rna, color=["PLP1", "CNP", "CTNNA3"])
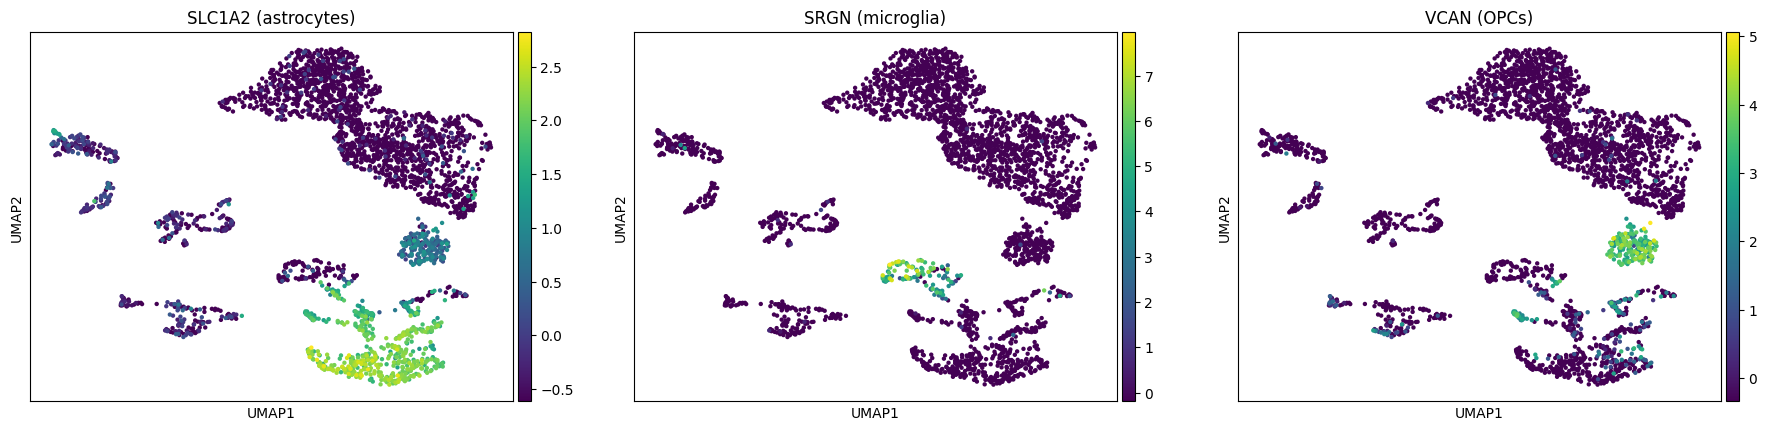
Similarly, we can label astrocytes, microglia and oligodendrocyte precursor cells (OPCs):
[28]:
sc.pl.umap(rna, color=["SLC1A2", "SRGN", "VCAN"],
           title=["SLC1A2 (astrocytes)", "SRGN (microglia)", "VCAN (OPCs)"])
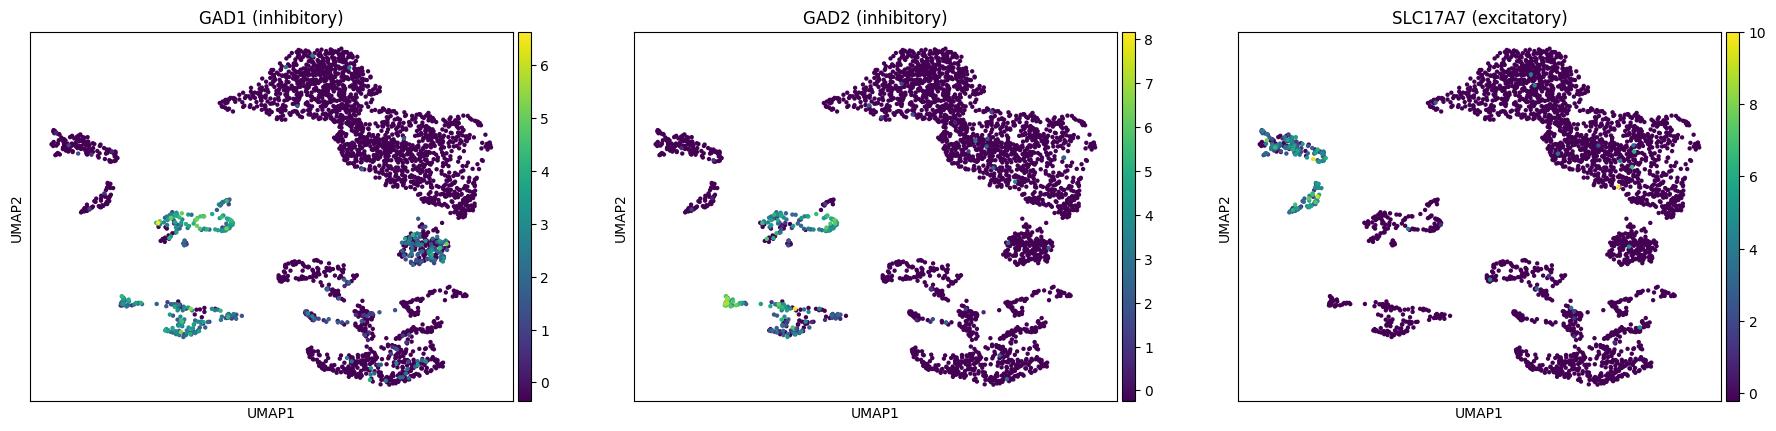
There are a few markers that are used to distinguish between inhibitory and excitatory neurons (see e.g. Hodge2019):
[29]:
sc.pl.umap(rna, color=["GAD1", "GAD2", "SLC17A7"],
           title=["GAD1 (inhibitory)", "GAD2 (inhibitory)", "SLC17A7 (excitatory)"])
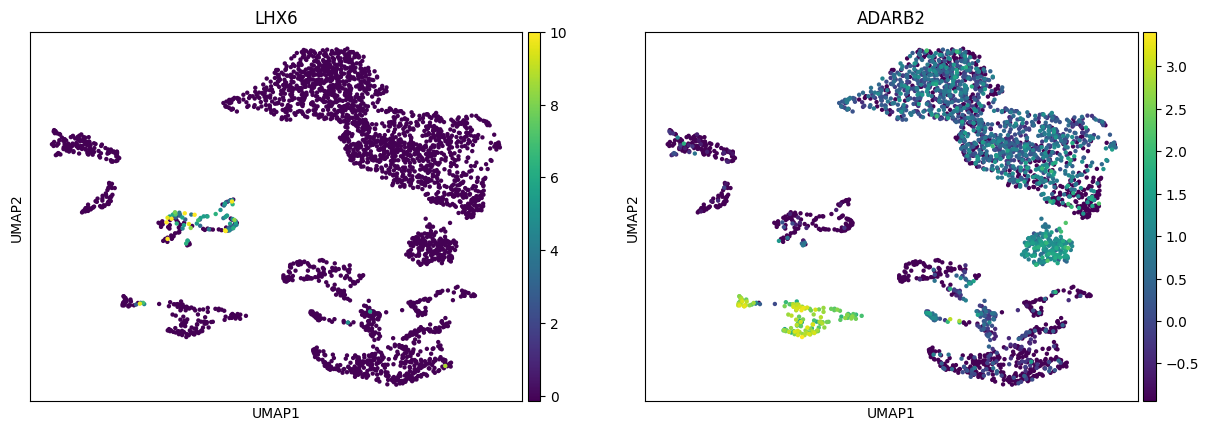
E.g. from the same paper we can learn that inhibitory neurons form two major branches distinguished by expression of ADARB2 and LHX6:
[30]:
sc.pl.umap(rna, color=["LHX6", "ADARB2"])
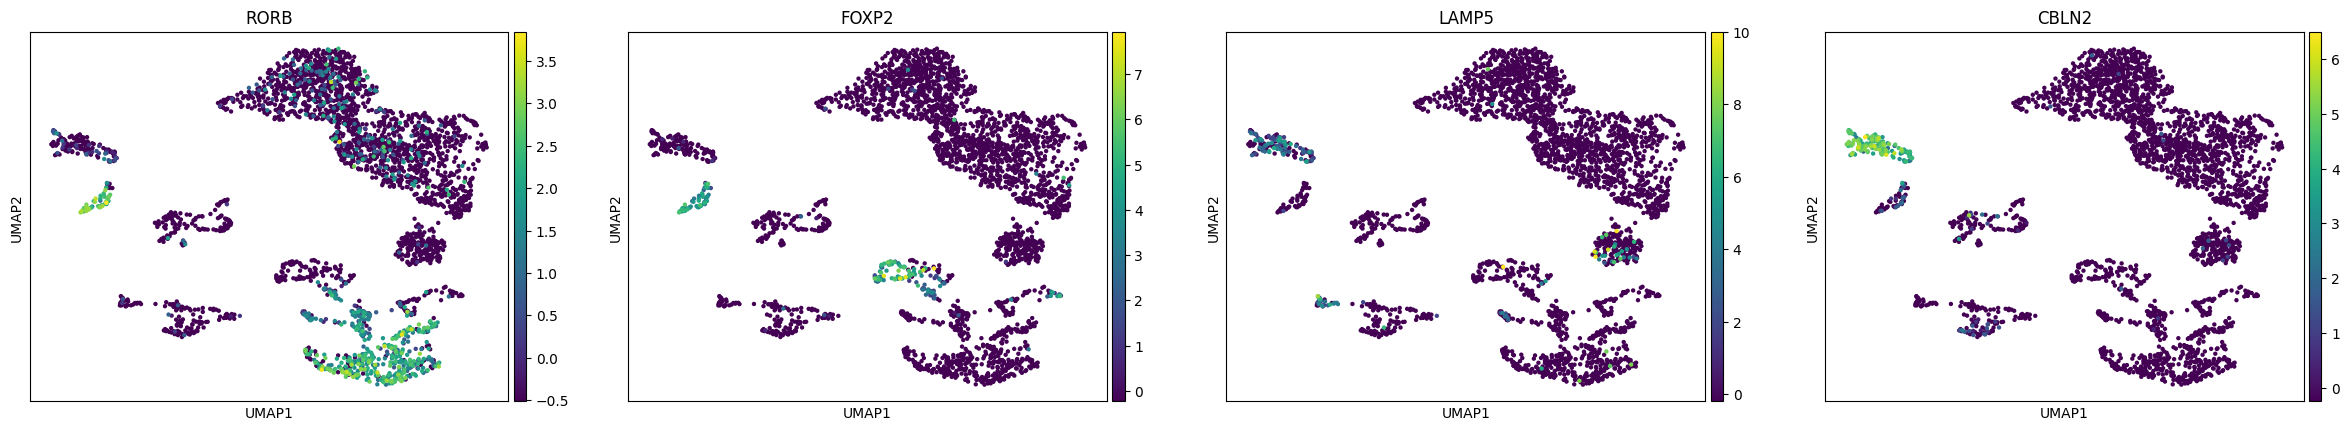
Analogously, different excitatory neurons subtypes can be distinguished:
[31]:
sc.pl.umap(rna, color=["RORB", "FOXP2", "LAMP5", "CBLN2"])
[32]:
new_cluster_names = {
    "0": "oligodendrocyte",
    "1": "oligodendrocyte",
    "3": "oligodendrocyte",
    "5": "oligodendrocyte",
    "14": "oligodendrocyte",
    "4": "OPC",
    "8": "microglia",
    "2": "astrocyte",
    "10": "astrocyte",
    "11": "astrocyte",
    "12": "astrocyte",
    "6": "excitatory_LAMP5",
    "13": "excitatory_RORB",
    "7": "inhibitory_LHX6",
    "9": "inhibitory_ADARB2",
    "15": "inhibitory_ADARB2",
}
[33]:
rna.obs['celltype'] = [new_cluster_names[cl] for cl in rna.obs.leiden.astype("str").values]
rna.obs.celltype = rna.obs.celltype.astype("category")
We will also re-order categories for the next plots:
[34]:
rna.obs.celltype = rna.obs.celltype.cat.set_categories([
    'oligodendrocyte', 'OPC', 'microglia', 'astrocyte',
    'excitatory_LAMP5', 'excitatory_RORB',
    'inhibitory_LHX6', 'inhibitory_ADARB2'
])
[35]:
from matplotlib.colors import to_hex
import matplotlib.pyplot as plt

cmap = plt.get_cmap('rainbow')
colors = cmap(np.linspace(0, 1, len(rna.obs.celltype.cat.categories)))

rna.uns["celltype_colors"] = list(map(to_hex, colors))
[36]:
sc.pl.umap(rna, color="celltype")
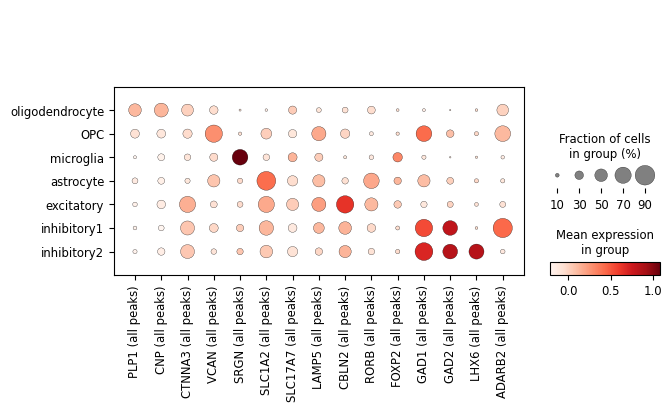
Finally, we’ll visualise some marker genes across cell types.
[37]:
marker_genes = ["PLP1", "CNP", "CTNNA3",
                "VCAN", "SRGN", "SLC1A2",
                "SLC17A7", "LAMP5", "CBLN2", "RORB", "FOXP2",
                "GAD1", "GAD2", "LHX6", "ADARB2",]
[38]:
sc.pl.dotplot(rna, marker_genes, groupby='celltype');
Preprocessing ATAC#
[39]:
from muon import atac as ac
Here, we’ll perform some QC and processing steps including normalisation.
[40]:
atac = mdata.mod['atac']
QC#
[41]:
sc.pp.calculate_qc_metrics(atac, percent_top=None, log1p=False, inplace=True)
[42]:
mu.pl.histogram(atac, ['n_genes_by_counts', 'total_counts'], linewidth=0)
Filter peaks which accessibility is not detected:
[43]:
mu.pp.filter_var(atac, 'n_cells_by_counts', lambda x: x >= 10)
Filter cells:
[44]:
print(f"Before: {atac.n_obs} cells")
mu.pp.filter_obs(atac, 'total_counts', lambda x: (x >= 1000) & (x <= 80000))
print(f"(After total_counts: {atac.n_obs} cells)")
mu.pp.filter_obs(atac, 'n_genes_by_counts', lambda x: (x >= 100) & (x <= 30000))
print(f"After: {atac.n_obs} cells")
Before: 3233 cells
(After total_counts: 2977 cells)
After: 2976 cells
Let’s see how the data looks after filtering:
[45]:
mu.pl.histogram(atac, ['n_genes_by_counts', 'total_counts'], linewidth=0)
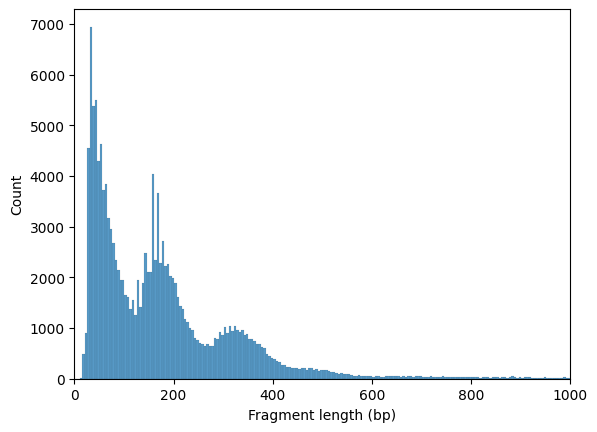
There are a few expectations about how ATAC-seq data looks like as noted in the hitchhiker’s guide to ATAC-seq data analysis for instance.
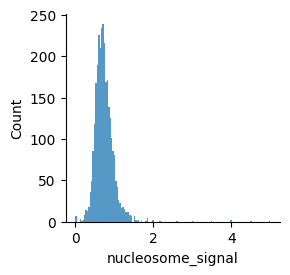
Nucleosome signal#
Fragment size distribution typically reflects nucleosome binding pattern showing enrichment around values corresponding to fragments bound to a single nucleosome (between 147 bp and 294 bp) as well as nucleosome-free fragments (shorter than 147 bp).
To work with the fragments file, pysam is required.
[46]:
ac.pl.fragment_histogram(atac, region='chr1:1-2000000')
Fetching Regions...: 100%|██████████| 1/1 [00:01<00:00, 1.28s/it]
The ratio of mono-nucleosome cut fragments to nucleosome-free fragments can be called nucleosome signal, and it can be estimated using a subset of fragments.
[47]:
ac.tl.nucleosome_signal(atac, n=1e6)
Reading Fragments: 100%|██████████| 1000000/1000000 [00:05<00:00, 198104.18it/s]
[48]:
mu.pl.histogram(atac, "nucleosome_signal", linewidth=0)
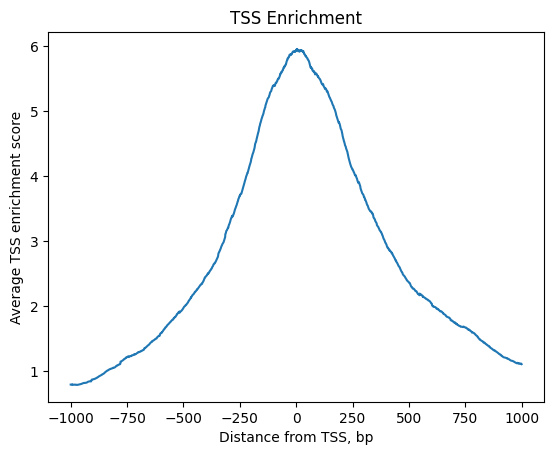
TSS enrichment#
We can expect chromatin accessibility enriched around transcription start sites (TSS) compared to accessibility of flanking regions. Thus this measure averaged across multiple genes can serve as one more quality control metric.
The positions of transcription start sites can be obtained from the interval field of the gene annotation in the rna modality:
[49]:
ac.tl.get_gene_annotation_from_rna(mdata['rna']).head(3) # accepts MuData with 'rna' modality or mdata['rna'] AnnData directly
[49]:
| Chromosome | Start | End | gene_id | gene_name | |
|---|---|---|---|---|---|
| MIR1302-2HG | chr1 | 29553 | 30267 | ENSG00000243485 | MIR1302-2HG |
| FAM138A | chr1 | 36080 | 36081 | ENSG00000237613 | FAM138A |
| OR4F5 | chr1 | 65418 | 69055 | ENSG00000186092 | OR4F5 |
TSS enrichment function will return an AnnData object with cells x bases dimensions where bases correspond to positions around TSS and are defined by extend_upstream and extend_downstream parameters, each of them being 1000 bp by default. It will also record tss_score in the original object.
[50]:
tss = ac.tl.tss_enrichment(mdata, n_tss=1000) # by default, features=ac.tl.get_gene_annotation_from_rna(mdata)
Fetching Regions...: 100%|██████████| 1000/1000 [00:16<00:00, 59.73it/s]
[51]:
tss
[51]:
AnnData object with n_obs × n_vars = 2976 × 2001
    obs: 'n_genes_by_counts', 'total_counts', 'nucleosome_signal', 'tss_score'
    var: 'TSS_position'
[52]:
ac.pl.tss_enrichment(tss)
Normalisation#
[53]:
atac.layers["counts"] = atac.X.copy()
sc.pp.normalize_total(atac, target_sum=1e4)
sc.pp.log1p(atac)
atac.layers["lognorm"] = atac.X.copy()
There can be multiple options for ATAC-seq data normalisation.
Here we will use the same log-normalisation and PCA that we are used to from scRNA-seq analysis, however we note there’s also ac.pp.tfidf() that can be used on the atac with atac.X containing counts.
Define informative features#
[54]:
sc.pp.highly_variable_genes(atac, min_mean=0.05, max_mean=1.5, min_disp=.5)
[55]:
sc.pl.highly_variable_genes(atac)
[56]:
np.sum(atac.var.highly_variable)
[56]:
13877
Scaling and PCA#
[57]:
sc.pp.scale(atac, max_value=10)
[58]:
sc.tl.pca(atac, svd_solver='arpack')
[59]:
ac.pl.pca(atac, color=['NRCAM', 'SLC1A2', 'SRGN', 'VCAN'], layer='lognorm', func='mean')
[60]:
sc.pl.pca_variance_ratio(atac, log=True)
Finding cell neighbours and clustering cells#
[61]:
sc.pp.neighbors(atac, n_neighbors=10, n_pcs=20)
[62]:
sc.tl.leiden(atac, resolution=.5)
Non-linear dimensionality reduction#
[63]:
sc.tl.umap(atac, spread=1., min_dist=.5, random_state=11)
[64]:
sc.pl.umap(atac, color="leiden", legend_loc="on data")
/usr/local/opt/python@3.8/Frameworks/Python.framework/Versions/3.8/lib/python3.8/site-packages/anndata/_core/anndata.py:1228: FutureWarning: The `inplace` parameter in pandas.Categorical.reorder_categories is deprecated and will be removed in a future version. Reordering categories will always return a new Categorical object.
  c.reorder_categories(natsorted(c.categories), inplace=True)
... storing 'feature_types' as categorical
/usr/local/opt/python@3.8/Frameworks/Python.framework/Versions/3.8/lib/python3.8/site-packages/anndata/_core/anndata.py:1228: FutureWarning: The `inplace` parameter in pandas.Categorical.reorder_categories is deprecated and will be removed in a future version. Reordering categories will always return a new Categorical object.
  c.reorder_categories(natsorted(c.categories), inplace=True)
... storing 'genome' as categorical
Marker genes and celltypes#
[65]:
ac.tl.rank_peaks_groups(atac, 'leiden', method='t-test')
/usr/local/opt/python@3.8/Frameworks/Python.framework/Versions/3.8/lib/python3.8/site-packages/scanpy/tools/_rank_genes_groups.py:420: RuntimeWarning: invalid value encountered in log2
  self.stats[group_name, 'logfoldchanges'] = np.log2(
/usr/local/opt/python@3.8/Frameworks/Python.framework/Versions/3.8/lib/python3.8/site-packages/scanpy/tools/_rank_genes_groups.py:420: RuntimeWarning: invalid value encountered in log2
  self.stats[group_name, 'logfoldchanges'] = np.log2(
/usr/local/opt/python@3.8/Frameworks/Python.framework/Versions/3.8/lib/python3.8/site-packages/scanpy/tools/_rank_genes_groups.py:420: RuntimeWarning: invalid value encountered in log2
  self.stats[group_name, 'logfoldchanges'] = np.log2(
/usr/local/opt/python@3.8/Frameworks/Python.framework/Versions/3.8/lib/python3.8/site-packages/scanpy/tools/_rank_genes_groups.py:420: RuntimeWarning: invalid value encountered in log2
  self.stats[group_name, 'logfoldchanges'] = np.log2(
/usr/local/opt/python@3.8/Frameworks/Python.framework/Versions/3.8/lib/python3.8/site-packages/scanpy/tools/_rank_genes_groups.py:420: RuntimeWarning: invalid value encountered in log2
  self.stats[group_name, 'logfoldchanges'] = np.log2(
/usr/local/opt/python@3.8/Frameworks/Python.framework/Versions/3.8/lib/python3.8/site-packages/scanpy/tools/_rank_genes_groups.py:420: RuntimeWarning: invalid value encountered in log2
  self.stats[group_name, 'logfoldchanges'] = np.log2(
/usr/local/opt/python@3.8/Frameworks/Python.framework/Versions/3.8/lib/python3.8/site-packages/scanpy/tools/_rank_genes_groups.py:420: RuntimeWarning: invalid value encountered in log2
  self.stats[group_name, 'logfoldchanges'] = np.log2(
/usr/local/opt/python@3.8/Frameworks/Python.framework/Versions/3.8/lib/python3.8/site-packages/scanpy/tools/_rank_genes_groups.py:420: RuntimeWarning: invalid value encountered in log2
  self.stats[group_name, 'logfoldchanges'] = np.log2(
/usr/local/opt/python@3.8/Frameworks/Python.framework/Versions/3.8/lib/python3.8/site-packages/scanpy/tools/_rank_genes_groups.py:420: RuntimeWarning: invalid value encountered in log2
  self.stats[group_name, 'logfoldchanges'] = np.log2(
/usr/local/opt/python@3.8/Frameworks/Python.framework/Versions/3.8/lib/python3.8/site-packages/scanpy/tools/_rank_genes_groups.py:420: RuntimeWarning: invalid value encountered in log2
  self.stats[group_name, 'logfoldchanges'] = np.log2(
[66]:
result = atac.uns['rank_genes_groups']
groups = result['names'].dtype.names

try:
    pd.set_option("max_columns", 50)
except:
    # https://pandas.pydata.org/pandas-docs/stable/user_guide/options.html
    pd.set_option("display.max_columns", 50)

pd.DataFrame(
    {group + '_' + key[:1]: result[key][group]
    for group in groups for key in ['names', 'genes', 'pvals']}).head(10)
[66]:
| 0_n | 0_g | 0_p | 1_n | 1_g | 1_p | 2_n | 2_g | 2_p | 3_n | 3_g | 3_p | 4_n | 4_g | 4_p | 5_n | 5_g | 5_p | 6_n | 6_g | 6_p | 7_n | 7_g | 7_p | 8_n | 8_g | 8_p | 9_n | 9_g | 9_p | |
|---|---|---|---|---|---|---|---|---|---|---|---|---|---|---|---|---|---|---|---|---|---|---|---|---|---|---|---|---|---|---|
| 0 | chr19:10517127-10518023 | S1PR5 | 3.282859e-120 | chr9:137194149-137195061 | SSNA1, TPRN | 1.687440e-07 | chr15:88954455-88955355 | MFGE8 | 1.041462e-51 | chr20:64205357-64206289 | MYT1 | 2.161747e-24 | chr3:93470143-93471053 | 7.728457e-64 | chr2:172102411-172103256 | DLX2, DLX2-DT | 2.862112e-17 | chr3:93470143-93471053 | 7.931826e-32 | chr8:141128016-141128911 | DENND3, AC040970.1 | 2.511727e-16 | chr3:93470143-93471053 | 1.401951e-14 | chr5:5421992-5422922 | ICE1, AC091978.1 | 5.036902e-08 | |||
| 1 | chr17:4533823-4534672 | MYBBP1A, SPNS2 | 1.496385e-105 | chr2:155733016-155733956 | 2.192973e-07 | chr11:116113975-116114894 | LINC02703 | 3.233616e-48 | chr1:235649644-235650468 | GNG4 | 1.018436e-19 | chr19:17830561-17831448 | JAK3, INSL3 | 1.501875e-26 | chr19:17830561-17831448 | JAK3, INSL3 | 1.785222e-13 | chr7:98869781-98870591 | TMEM130 | 4.118493e-17 | chr19:16324216-16325125 | KLF2 | 1.639932e-15 | chr11:126082212-126083139 | CDON | 7.136948e-11 | chr3:150762879-150763765 | SIAH2, SIAH2-AS1 | 3.660542e-05 | |
| 2 | chr9:137025205-137026128 | ABCA2, C9orf139 | 3.410716e-103 | chr11:67410019-67410923 | CARNS1, TBC1D10C | 2.165031e-07 | chr17:7667553-7668441 | TP53 | 1.768672e-45 | chr7:159144522-159145447 | VIPR2 | 1.325963e-19 | chr22:20424868-20425672 | SCARF2 | 1.767269e-23 | chr11:43580653-43581568 | MIR670HG, AC068205.1 | 2.103368e-13 | chr6:34465545-34466455 | PACSIN1 | 4.656562e-16 | chr19:16896819-16897691 | F2RL3, CPAMD8 | 1.884857e-14 | chr22:44668148-44669084 | PRR5 | 7.608635e-11 | chr9:4740847-4741719 | AK3 | 1.084190e-05 |
| 3 | chr16:19005407-19006339 | TMC7 | 4.832642e-96 | chr22:27641917-27642832 | AL121885.3 | 4.611435e-07 | chr2:63050200-63051132 | OTX1 | 6.880293e-44 | chr10:115092748-115093673 | ATRNL1 | 1.429046e-19 | chr3:6860613-6861507 | GRM7 | 1.402679e-23 | chr1:159141445-159142305 | CADM3 | 6.791239e-13 | chr20:38723830-38724734 | SLC32A1 | 1.225148e-15 | chr19:6730124-6731045 | GPR108 | 3.679240e-14 | chr3:150255199-150256067 | LINC01213 | 2.284251e-10 | chr6:41712509-41713277 | TFEB, AL035588.1 | 3.375334e-05 |
| 4 | chr16:1046313-1047208 | AC009041.3 | 1.443936e-92 | chr3:134366739-134367654 | AMOTL2 | 5.778747e-07 | chr10:117551948-117552792 | EMX2OS | 4.414343e-43 | chr22:37412328-37413244 | ELFN2 | 1.669758e-19 | chr3:11136760-11137765 | HRH1 | 1.013443e-22 | chr20:63501902-63502698 | AL121829.1 | 7.636812e-13 | chr2:172084895-172085680 | DLX1 | 8.649997e-15 | chr5:40679337-40680186 | PTGER4, TTC33 | 9.874328e-14 | chr14:93926839-93927741 | FAM181A, FAM181A-AS1 | 2.292530e-10 | chr5:68187291-68188210 | LINC02219 | 8.983458e-05 |
| 5 | chr9:137021806-137022721 | C9orf139, ABCA2 | 4.150217e-90 | chr1:26555262-26556177 | RPS6KA1 | 6.391270e-07 | chr3:47542326-47543264 | ELP6 | 1.358418e-42 | chr1:103108243-103109114 | COL11A1 | 3.066915e-19 | chr2:96148230-96149146 | AC012307.1 | 1.741706e-21 | chr20:38723830-38724734 | SLC32A1 | 1.403797e-12 | chr2:172102411-172103256 | DLX2, DLX2-DT | 1.419611e-14 | chr2:8583428-8584334 | LINC01814 | 1.619466e-13 | chr5:90558277-90559161 | ADGRV1 | 2.171143e-10 | chr17:60599687-60600583 | PPM1D | 1.355020e-04 |
| 6 | chr1:25563471-25564360 | LDLRAP1, AL606491.1 | 1.641379e-88 | chr2:16069783-16070654 | GACAT3 | 2.328614e-06 | chr4:7244199-7245095 | SORCS2 | 2.033508e-42 | chr14:28766242-28767112 | FOXG1 | 1.565355e-18 | chr19:42352133-42353032 | MEGF8 | 8.060144e-21 | chr10:133336493-133337402 | CALY | 2.029217e-12 | chr22:43862092-43862988 | SULT4A1 | 1.819093e-14 | chr19:48492859-48493838 | LMTK3 | 7.564888e-13 | chr12:126742073-126742937 | LINC00943, LINC00944 | 2.478765e-10 | chr2:241355778-241356651 | FARP2 | 1.397696e-04 |
| 7 | chr5:669160-670066 | TPPP, AC026740.1 | 3.579202e-86 | chr9:137025205-137026128 | ABCA2, C9orf139 | 2.419066e-06 | chr3:93470143-93471053 | 3.309390e-44 | chr3:119329382-119330238 | ARHGAP31-AS1, ARHGAP31 | 2.371422e-18 | chr7:45407786-45408730 | AC073325.1 | 1.055004e-19 | chr7:45920598-45921486 | IGFBP3 | 2.266860e-12 | chr1:59814315-59815178 | HOOK1 | 5.248293e-14 | chr17:82216461-82217320 | AC132872.2 | 1.650544e-12 | chr7:153523847-153524661 | LINC01287 | 2.704849e-10 | chr15:39920566-39921425 | GPR176, GPR176-DT | 2.180990e-04 | |
| 8 | chr9:128408873-128409744 | CERCAM | 4.301388e-84 | chr20:48656406-48657246 | AL035106.1, PREX1 | 2.625672e-06 | chr1:59986377-59987289 | CYP2J2 | 7.442040e-42 | chr6:3227300-3228175 | TUBB2B | 4.510227e-18 | chr5:912329-913117 | TRIP13, AC122719.3 | 1.287305e-19 | chr11:66420523-66421199 | NPAS4 | 2.531857e-12 | chr19:17830561-17831448 | JAK3, INSL3 | 9.146197e-14 | chr20:35615908-35616785 | SPAG4 | 2.433515e-12 | chr11:35419306-35420052 | SLC1A2, AC090625.2 | 2.676955e-10 | chr10:75210119-75211032 | VDAC2 | 2.854747e-04 |
| 9 | chr20:48656406-48657246 | AL035106.1, PREX1 | 1.801061e-83 | chr19:6515932-6516671 | TUBB4A | 3.436492e-06 | chr11:35462968-35463888 | PAMR1 | 1.023938e-41 | chr16:88375908-88376817 | ZNF469 | 1.888004e-17 | chr12:2998746-2999574 | TEAD4 | 1.546582e-19 | chr11:9003656-9004528 | NRIP3, AC079296.1 | 3.130327e-12 | chr14:23578440-23579365 | JPH4 | 1.451351e-13 | chr1:12166609-12167447 | TNFRSF1B | 3.207113e-12 | chr15:88954455-88955355 | MFGE8 | 3.173339e-10 | chr6:29942038-29942903 | HLA-A | 3.621296e-04 |
TMC7, CERCAM, TUBB4A (clusters 0 and 1) are oligodendrocyte markers.
Cluster 4 genes (GRM7, MEGF8) point to excitatory neurons, cluster 5 and 6 genes DLX1/DLX2, SLC32A1, CADM3 point to inhibitory neurons, cluster 7 genes (DENND3) — to microglia.
Cluster 3 genes (MYT1 — Myelin transcription factor, GNG4, etc.) point to OPCs. OTX1 (cluster 2) is an astrocyte marker, just as ADGRV1 is in cluster 8.
Adenylate kinase 3 (AK3 in cluster 9) is mainly expressed in mitochondria so this is likely a low-quality cell cluster.
Having studied markers of individual clusters, we will filter some cells out before assigning cell types names to clusters.
[67]:
mu.pp.filter_obs(atac, "leiden", lambda x: ~x.isin(["9"]))
[68]:
new_cluster_names = {
    "0": "oligodendrocyte",
    "1": "oligodendrocyte",
    "3": "OPC",
    "7": "microglia",
    "2": "astrocyte",
    "8": "astrocyte",
    "4": "excitatory",
    "5": "inhibitory1",
    "6": "inhibitory2",
}
[69]:
atac.obs['celltype'] = [new_cluster_names[cl] for cl in atac.obs.leiden.astype("str").values]
atac.obs.celltype = atac.obs.celltype.astype("category")
We will also re-order categories for the next plots:
[70]:
atac.obs.celltype = atac.obs.celltype.cat.set_categories([
    'oligodendrocyte', 'OPC', 'microglia', 'astrocyte',
    'excitatory', 'inhibitory1', 'inhibitory2'
])
[71]:
from matplotlib.colors import to_hex
import matplotlib.pyplot as plt

cmap = plt.get_cmap('rainbow')
colors = cmap(np.linspace(0, 1, len(atac.obs.celltype.cat.categories)))

atac.uns["celltype_colors"] = list(map(to_hex, colors))
[72]:
sc.pl.umap(atac, color="celltype")

We can also visualise the same marker genes we plotted for the RNA modality to see if peak accessibility, whether for promoters or for enhancers, resembles the cell type-specific behaviour of these genes.
[73]:
ac.pl.dotplot(atac, marker_genes, groupby='celltype')
Multi-omics integration#
We’ll update the MuData object with the information from the modalities and discard cells that are not in both modalities (cells were filtered independently in two modalities).
[75]:
mdata.update()
[76]:
mu.pp.intersect_obs(mdata)
MOFA#
MOFA (Argelaguet, Arnol, Bredikhin et al., 2020) is a statistical framework for comprehensive integration of multi-omics data.
[77]:
mu.tl.mofa(mdata, n_factors=20, outfile="brain3k_mofa_model.hdf5", gpu_mode=True)
        #########################################################
        ###           __  __  ____  ______                    ###
        ###          |  \/  |/ __ \|  ____/\    _             ###
        ###          | \  / | |  | | |__ /  \ _| |_           ###
        ###          | |\/| | |  | |  __/ /\ \_   _|          ###
        ###          | |  | | |__| | | / ____ \|_|            ###
        ###          |_|  |_|\____/|_|/_/    \_\              ###
        ###                                                   ###
        #########################################################


Loaded view='rna' group='group1' with N=2821 samples and D=5924 features...
Loaded view='atac' group='group1' with N=2821 samples and D=13877 features...


Model options:
- Automatic Relevance Determination prior on the factors: True
- Automatic Relevance Determination prior on the weights: True
- Spike-and-slab prior on the factors: False
- Spike-and-slab prior on the weights: True
Likelihoods:
- View 0 (rna): gaussian
- View 1 (atac): gaussian


GPU mode is activated, but GPU not found... switching to CPU mode
For GPU mode, you need:
1 - Make sure that you are running MOFA+ on a machine with an NVIDIA GPU
2 - Install CUPY following instructions on https://docs-cupy.chainer.org/en/stable/install.html


######################################
## Training the model with seed 1 ##
######################################


Converged!


#######################
## Training finished ##
#######################


Saving model in brain3k_mofa_model.hdf5...
Saved MOFA embeddings in .obsm['X_mofa'] slot and their loadings in .varm['LFs'].
[78]:
sc.pp.neighbors(mdata, use_rep="X_mofa")
sc.tl.umap(mdata, random_state=1)
[79]:
mdata.obsm["X_mofa_umap"] = mdata.obsm["X_umap"]
[80]:
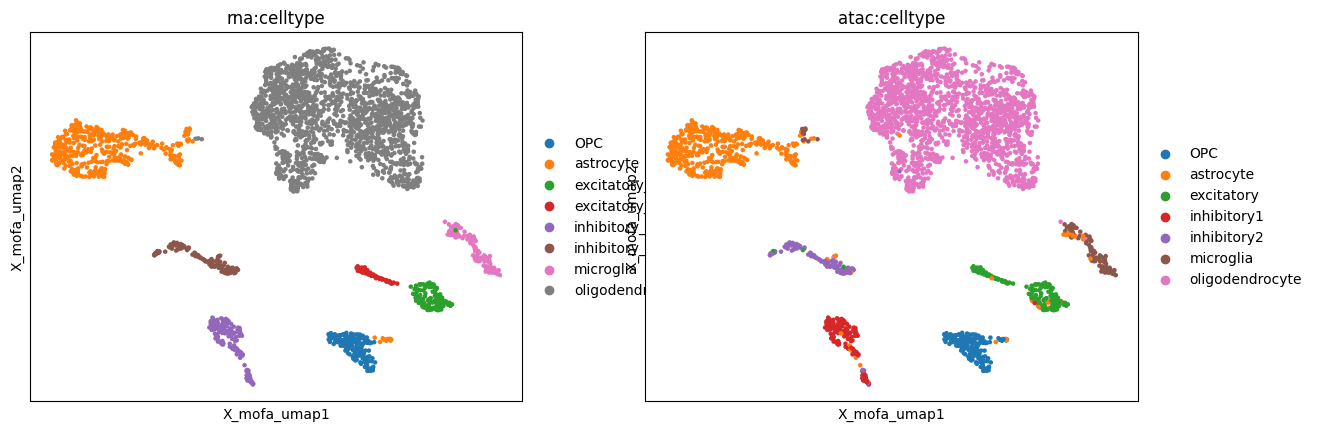
mu.pl.embedding(mdata, basis="X_mofa_umap", color=["rna:celltype", "atac:celltype"])
... storing 'rna:leiden' as categorical
... storing 'rna:celltype' as categorical
... storing 'atac:leiden' as categorical
... storing 'atac:celltype' as categorical
WNN#
WNN (Hao, Hao et al., 2021) is an unsupervised framework for integrative analysis of multiple modalities.
[81]:
# Since subsetting was performed after calculating nearest neighbours,
# we have to calculate them again for each modality.
sc.pp.neighbors(mdata['rna'])
sc.pp.neighbors(mdata['atac'])

# Calculate weighted nearest neighbors
mu.pp.neighbors(mdata, key_added='wnn')
[82]:
mu.tl.umap(mdata, neighbors_key='wnn', random_state=10)
[83]:
mdata.obsm["X_wnn_umap"] = mdata.obsm["X_umap"]
[84]:
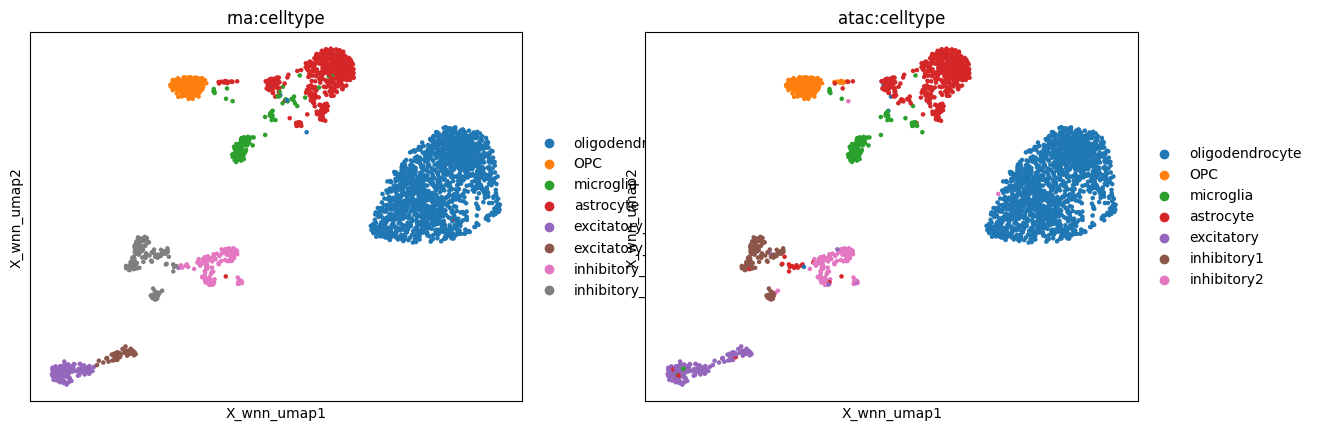
mu.pl.embedding(mdata, basis="X_wnn_umap", color=["rna:celltype", "atac:celltype"])
Snapshot#
We will now save the mdata object to an .h5mu file.
[85]:
mdata.write("data/brain3k_processed.h5mu")
... storing 'feature_types' as categorical
... storing 'interval' as categorical