CITE-seq data integration with weighted nearest neighbours
Contents
CITE-seq data integration with weighted nearest neighbours#
This noteboks demonstrated multimodal data integration using weighted nearest neighbours.
Multimodal nearest neighbor search for two modalities was described in the Seurat 4 paper (Hao et al, 2020) and was extended to arbitrary modality numbers in the TEA-seq paper (Swanson et al, 2020).
The data used in this notebook is on peripheral blood mononuclear cells (PBMCs) and has been provided by 10x Genomics.
[1]:
# Change directory to the root folder of the repository
import os
os.chdir("../")
Load libraries and data#
Import libraries:
[2]:
import numpy as np
import pandas as pd
import scanpy as sc

from matplotlib import colors
%matplotlib inline
[3]:
import muon as mu
[4]:
mdata = mu.read("data/pbmc5k_citeseq.h5mu")
[5]:
with mu.set_options(display_style="html", display_html_expand=0b000):
    display(mdata)
Metadata.obs8 elements
| rna:n_genes_by_counts | int32 | 2363,1259,1578,1908,1589,3136,1444,2699,2784,1495,... |
| rna:total_counts | float32 | 7375.0,3772.0,4902.0,6704.0,3900.0,11781.0,3861.0,... |
| rna:total_counts_mt | float32 | 467.0,343.0,646.0,426.0,363.0,939.0,430.0,1209.0,... |
| rna:pct_counts_mt | float32 | 6.3322038650512695,9.093318939208984,... |
| rna:leiden | category | 3,0,2,2,1,1,4,10,1,0,4,0,0,0,2,1,0,10,0,7,8,0,4,0,... |
| rna:celltype | category | intermediate mono,CD4+ naïve T,CD4+ memory T,... |
| louvain | category | 0,1,2,2,9,0,3,6,0,1,3,1,1,1,2,0,1,6,1,5,4,1,3,1,0,... |
| leiden | category | 0,1,2,2,6,0,3,6,0,1,3,1,1,1,2,0,1,6,1,5,4,1,3,1,0,... |
Embeddings & mappings.obsm4 elements
| X_mofa | float64 | numpy.ndarray | 30 dims |
| X_umap | float32 | numpy.ndarray | 2 dims |
| prot | bool | numpy.ndarray | |
| rna | bool | numpy.ndarray |
Distances.obsp2 elements
| connectivities | float32 | scipy.sparse.csr.csr_matrix |
| distances | float64 | scipy.sparse.csr.csr_matrix |
Miscellaneous.uns5 elements
| leiden | dict | 1 element | params: partition_improvement,random_state,resolution |
| louvain | dict | 1 element | params: partition_improvement,random_state,resolution |
| neighbors | dict | 3 elements | connectivities_key,distances_key,params |
| rna:celltype_colors | numpy.ndarray | 13 elements | #8000ff,#5641fd,#2c7ef7,#00b5eb,#2adddd,#54f6cb,... |
| umap | dict | 1 element | params: a,b,random_state |
prot3891 × 32
AnnData object 3891 obs × 32 varLayers.layers1 element
| counts | float32 | scipy.sparse.csr.csr_matrix |
Metadata.obs0 elements
No metadataEmbeddings.obsm2 elements
| X_pca | float32 | numpy.ndarray | 31 dims |
| X_umap | float32 | numpy.ndarray | 2 dims |
Distances.obsp2 elements
| connectivities | float32 | scipy.sparse.csr.csr_matrix |
| distances | float64 | scipy.sparse.csr.csr_matrix |
Miscellaneous.uns3 elements
| neighbors | anndata.compat._overloaded_dict.OverloadedDict | 3 elements | connectivities_key,distances_key,params |
| pca | dict | 3 elements | params,variance,variance_ratio |
| umap | dict | 1 element | params: a,b,random_state |
rna3891 × 17806
AnnData object 3891 obs × 17806 varLayers.layers0 elements
No layersMetadata.obs6 elements
| n_genes_by_counts | int32 | 2363,1259,1578,1908,1589,3136,1444,2699,2784,1495,... |
| total_counts | float32 | 7375.0,3772.0,4902.0,6704.0,3900.0,11781.0,3861.0,... |
| total_counts_mt | float32 | 467.0,343.0,646.0,426.0,363.0,939.0,430.0,1209.0,... |
| pct_counts_mt | float32 | 6.3322038650512695,9.093318939208984,... |
| leiden | category | 3,0,2,2,1,1,4,10,1,0,4,0,0,0,2,1,0,10,0,7,8,0,4,0,... |
| celltype | category | intermediate mono,CD4+ naïve T,CD4+ memory T,... |
Embeddings.obsm2 elements
| X_pca | float32 | numpy.ndarray | 50 dims |
| X_umap | float32 | numpy.ndarray | 2 dims |
Distances.obsp2 elements
| connectivities | float32 | scipy.sparse.csr.csr_matrix |
| distances | float64 | scipy.sparse.csr.csr_matrix |
Miscellaneous.uns8 elements
| celltype_colors | numpy.ndarray | 13 elements | #8000ff,#5641fd,#2c7ef7,#00b5eb,#2adddd,#54f6cb,... |
| hvg | dict | 1 element | flavor: seurat |
| leiden | dict | 1 element | params: n_iterations,random_state,resolution |
| leiden_colors | numpy.ndarray | 14 elements | #1f77b4,#ff7f0e,#279e68,#d62728,#aa40fc,#8c564b,... |
| neighbors | anndata.compat._overloaded_dict.OverloadedDict | 3 elements | connectivities_key,distances_key,params |
| pca | dict | 3 elements | params,variance,variance_ratio |
| rank_genes_groups | dict | 6 elements | logfoldchanges,names,params,pvals,pvals_adj,scores |
| umap | dict | 1 element | params: a,b,random_state |
MOFA integration#
In the previous chapter, the data has been preprocessed and integrated with MOFA:
[6]:
# Make a colour scale
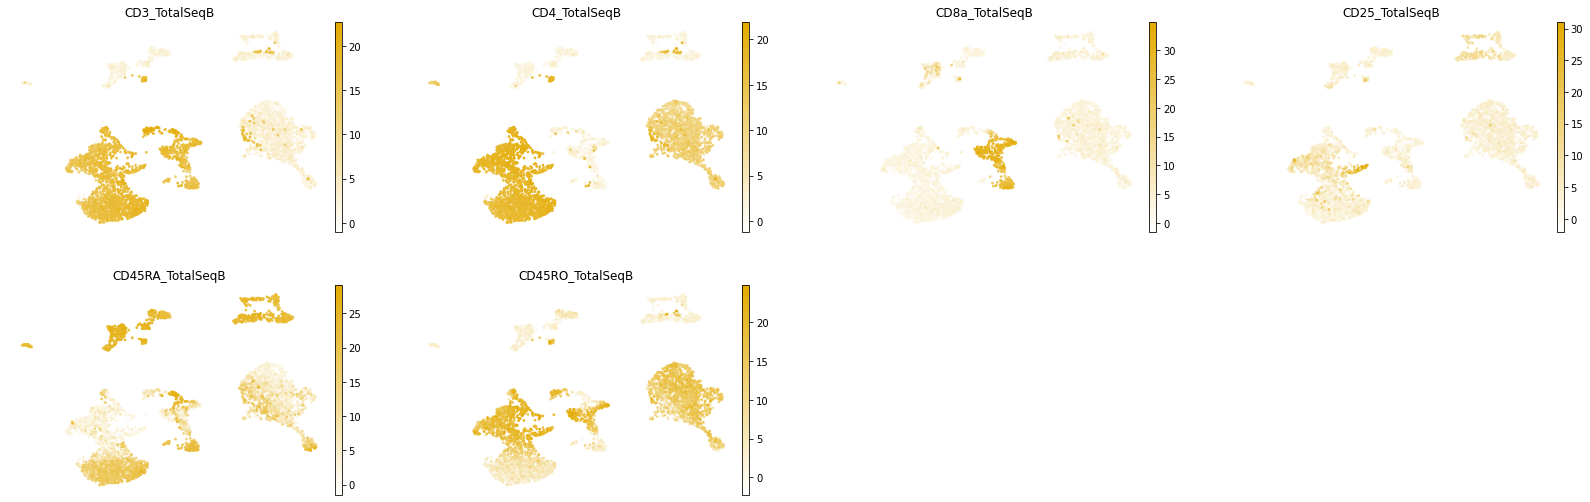
prot_cmap = colors.LinearSegmentedColormap.from_list('protein cmap', ['#FFFFFF','#E3AA00'], N=256)
mu.pl.umap(mdata, color=['CD3_TotalSeqB', # T cells
'CD4_TotalSeqB', 'CD8a_TotalSeqB', # CD4+/CD8+ T cells
'CD25_TotalSeqB', # regulatory T cells
'CD45RA_TotalSeqB', 'CD45RO_TotalSeqB' # naïve/memory
],
frameon=False,
cmap=prot_cmap,
)
/usr/local/lib/python3.8/site-packages/pandas/core/arrays/categorical.py:2487: FutureWarning: The `inplace` parameter in pandas.Categorical.remove_unused_categories is deprecated and will be removed in a future version.
  res = method(*args, **kwargs)
We will save the MOFA-based UMAP space under a distinctive name:
[7]:
mdata.obsm["X_mofa_umap"] = mdata.obsm["X_umap"]
WNN integration#
In the MOFA integration above, cell neigbourhood graph was computed using MOFA factors that had been learned on both modalities.
We can also compute this graph using a weighted nearest neighbours (WNN) method. It will use nearest neighbour graphs for each modality and will generate a joint one. In muon, this is implemented under mu.pp.neighbors as a natural extension of sc.pp.neighbors from scanpy:
[8]:
# Since subsetting was performed after calculating nearest neighbours,
# we have to calculate them again for each modality.
sc.pp.neighbors(mdata['rna'])
sc.pp.neighbors(mdata['prot'])

# Calculate weighted nearest neighbors
mu.pp.neighbors(mdata, key_added='wnn')
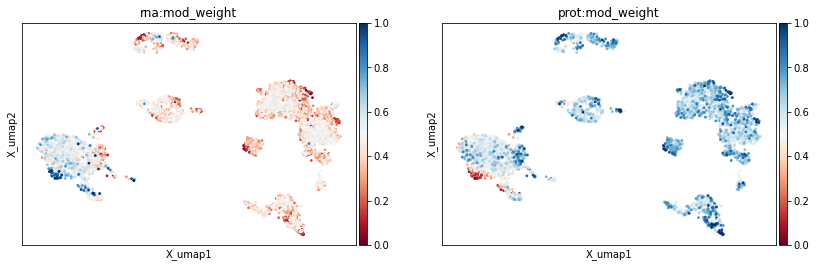
By default, modality weights are added to the mdata.obs data frame under the rna:mod_weight and prot:mod_weight, and this behaviour can be adjusted with options like add_weights_to_modalities to add weights to individual modalities instead and weight_key to change the name of the key.
The computed cell neighbourhood graph can be further used to compute UMAP coordinates.
The use_rep parameter is not a single values anymore for WNN, that’s why muon provides mu.tl.umap to handle this case.
[9]:
mdata.uns['wnn']['params']['use_rep']
[9]:
{'prot': -1, 'rna': -1}
[10]:
mu.tl.umap(mdata, neighbors_key='wnn', random_state=10)
[11]:
mu.pl.umap(mdata, color=['rna:mod_weight', 'prot:mod_weight'], cmap='RdBu')
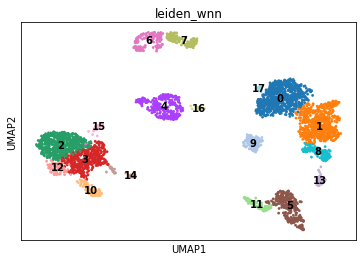
The computed cell neighbourhood graph can also be used for clustering:
[12]:
sc.tl.leiden(mdata, resolution=1.0, neighbors_key='wnn', key_added='leiden_wnn')
[13]:
sc.pl.umap(mdata, color='leiden_wnn', legend_loc='on data')
... storing 'rna:mt' as categorical
... storing 'feature_types' as categorical
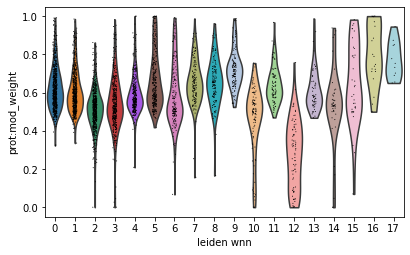
Modality weights can be visualized per celltype with existing plotting functions:
[14]:
sc.pl.violin(mdata, groupby='leiden_wnn', keys='prot:mod_weight')
We will use a destcriptive name to save the WNN-based UMAP under:
[15]:
mdata.obsm["X_wnn_umap"] = mdata.obsm["X_umap"]
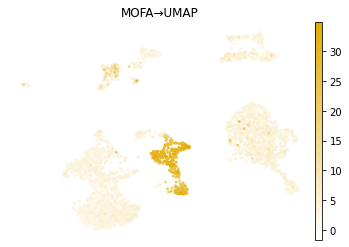
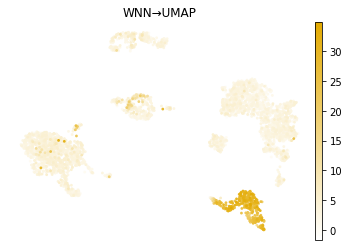
These embedding keys can be then easily used for plotting:
[16]:
mu.pl.embedding(mdata, basis="X_mofa_umap", frameon=False, title="MOFA\u2192UMAP", color="CD8a_TotalSeqB", cmap=prot_cmap)
mu.pl.embedding(mdata, basis="X_wnn_umap", frameon=False, title="WNN\u2192UMAP", color="CD8a_TotalSeqB", cmap=prot_cmap)
/usr/local/lib/python3.8/site-packages/pandas/core/arrays/categorical.py:2487: FutureWarning: The `inplace` parameter in pandas.Categorical.remove_unused_categories is deprecated and will be removed in a future version.
  res = method(*args, **kwargs)
[17]:
# Save the integrated dataset
mdata.write("data/pbmc5k_citeseq_multiembed.h5mu")